The Look360 monitoring dashboard brings everything we watch on your behalf into one place – competitors' prices and stock, Facebook posts and ads, and the health and reliability of your own online store. There is nothing to install: you sign in, see the situation at a glance, and receive the important changes in a daily email as well. This guide walks through every view and button, and ends with real-world examples that tie the features together into everyday work.
1 What Look360 is
Look360 is monitoring, automation and response in one package. The monitoring dashboard is your private workspace at an address where you sign in with your email and password. There you see every company you monitor – both your own store and your competitors – and every change the system has caught: a price drop, a stockout, a new Facebook post, an online-store outage.
The screenshots in this guide show the Estonian-language interface – the interface itself is the same in every language, and the buttons and menus are in the same places.
Everything works on a colour logic. The same three colours recur everywhere – on the dashboard, on a company card, in a table, on the charts:
We send the more important changes in a daily digest email as well, and the most critical ones straight away. You open the dashboard when you want to see more or change something.
2 Signing in
- Open Sign in – either from the top corner of the home page, from the top of this guide, or via the direct link we sent you.
- Enter your username – this is your email address (e.g. you@company.com).
- Enter your password and press Enter
- Forgot your password? – from the link below we email you a link to set a new password.
- No account yet? – the Register button takes you to the price list on the home page, where you can put a package together and sign up.
- Try without an account – the sign-in page has a public demo account that lets you click through every view with real sample data.
Your account is tied to your company. After signing in, you see your company name on the green bar at the top left – that is how you know you are in the right account.
4 Monitoring dashboard
This is your home view. Along the top you find the main buttons; below are the trend, the summary and the list of companies.
Top-bar buttons
- Add company – add a new company to monitor (see Section 5).
- Services – open the services and monthly-fee view.
- Refresh view – reloads the latest data and refreshes the screen. It does not run a new scan, only refreshes the view.
- Enable notifications – turns on push alerts to your phone (see Section 9).
- Rescan everything – runs the real scans (a new thorough scan of the sites) and takes a few minutes. This can be done once per day.
How does monitoring work? – help bar
At the top of the dashboard there is an expandable bar, How does monitoring work? Click it to read a short explanation. The first time, when you have no company yet, it is open.
Quick overview at the top
When you open the dashboard, you immediately see what matters most – before the charts and the table:
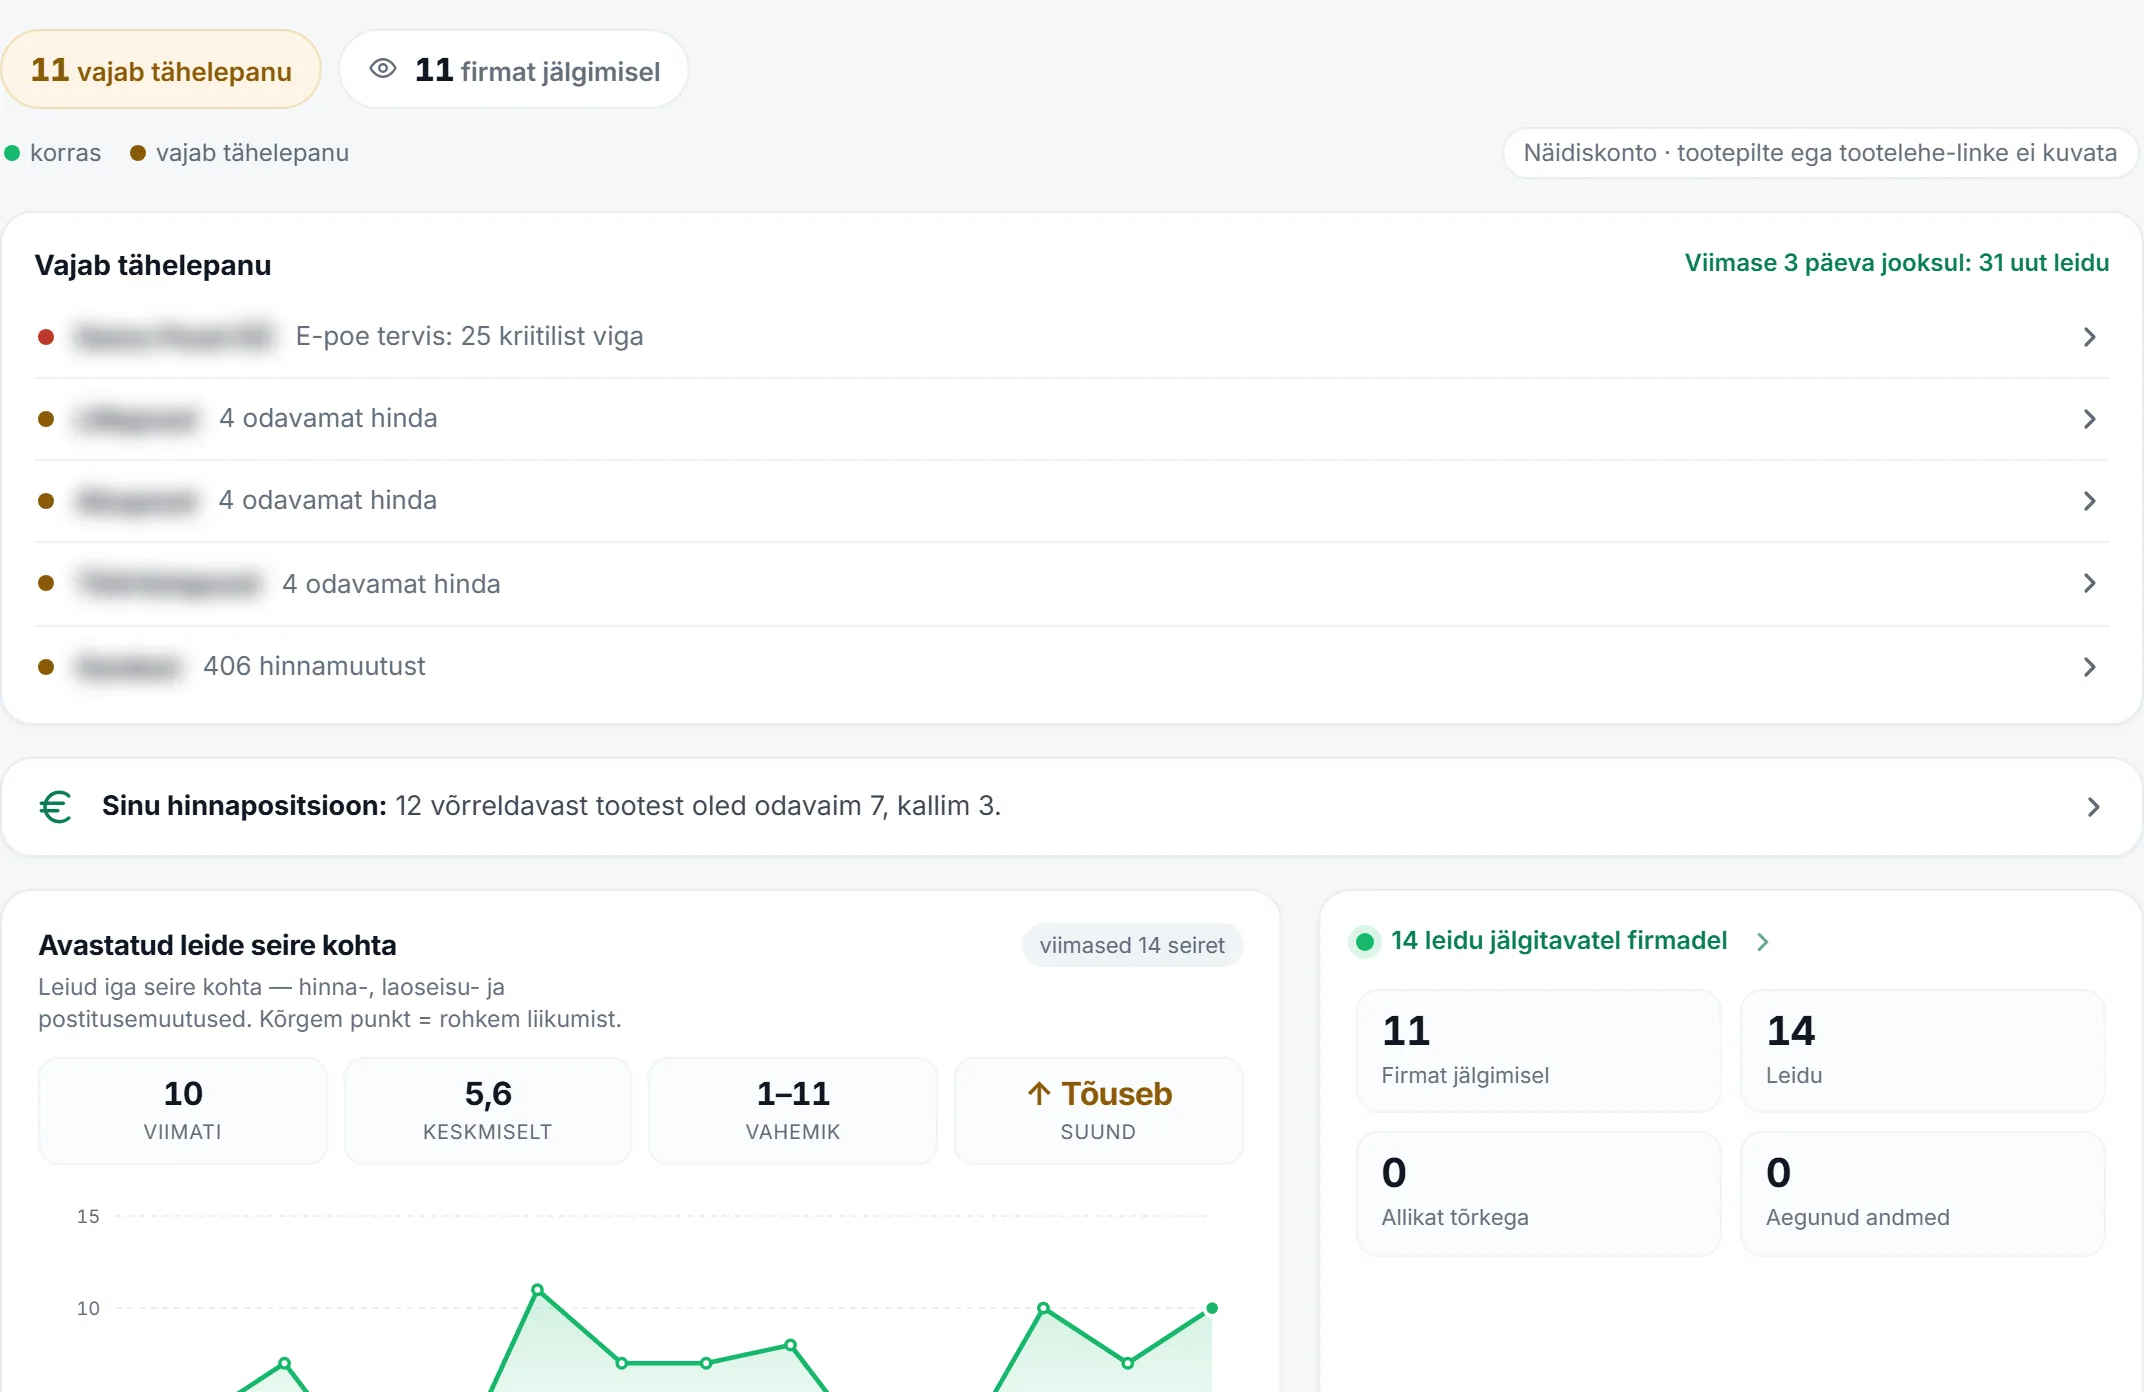
- Status bar – three chips at a glance: N need attention (a click scrolls to the list), N quiet and N companies monitored.
- Needs attention – the most important findings across all companies, one at a time and in order of importance. Red dot is a critical error in your own store, yellow a competitor's change. A click takes you straight to the company or to the price comparison. At the top right is a delta: "Since your last visit: N new findings". If nothing is pending, there is a green "All quiet" here.
- Your price position – one summary line: "Of N comparable products you are the cheapest on X, more expensive on Y". A click opens the price comparison.
Trend of findings
The chart shows how the number of findings has changed over recent scans – whether things are settling down or need more attention. Every chart has its axis scale and unit labelled; hover over the line to see the exact figure.
Summary
On the right are four numbers and a status line:
Tabs, views and export
- Tabs All My company Competitors – filter the list.
- Table / Cards – switch the shape of the list. The table is compact; the card view shows each company's channels and findings expanded straight away.
- Sort – order by default, by findings or by name.
- Export CSV – downloads the visible table as a file you can open in Excel.
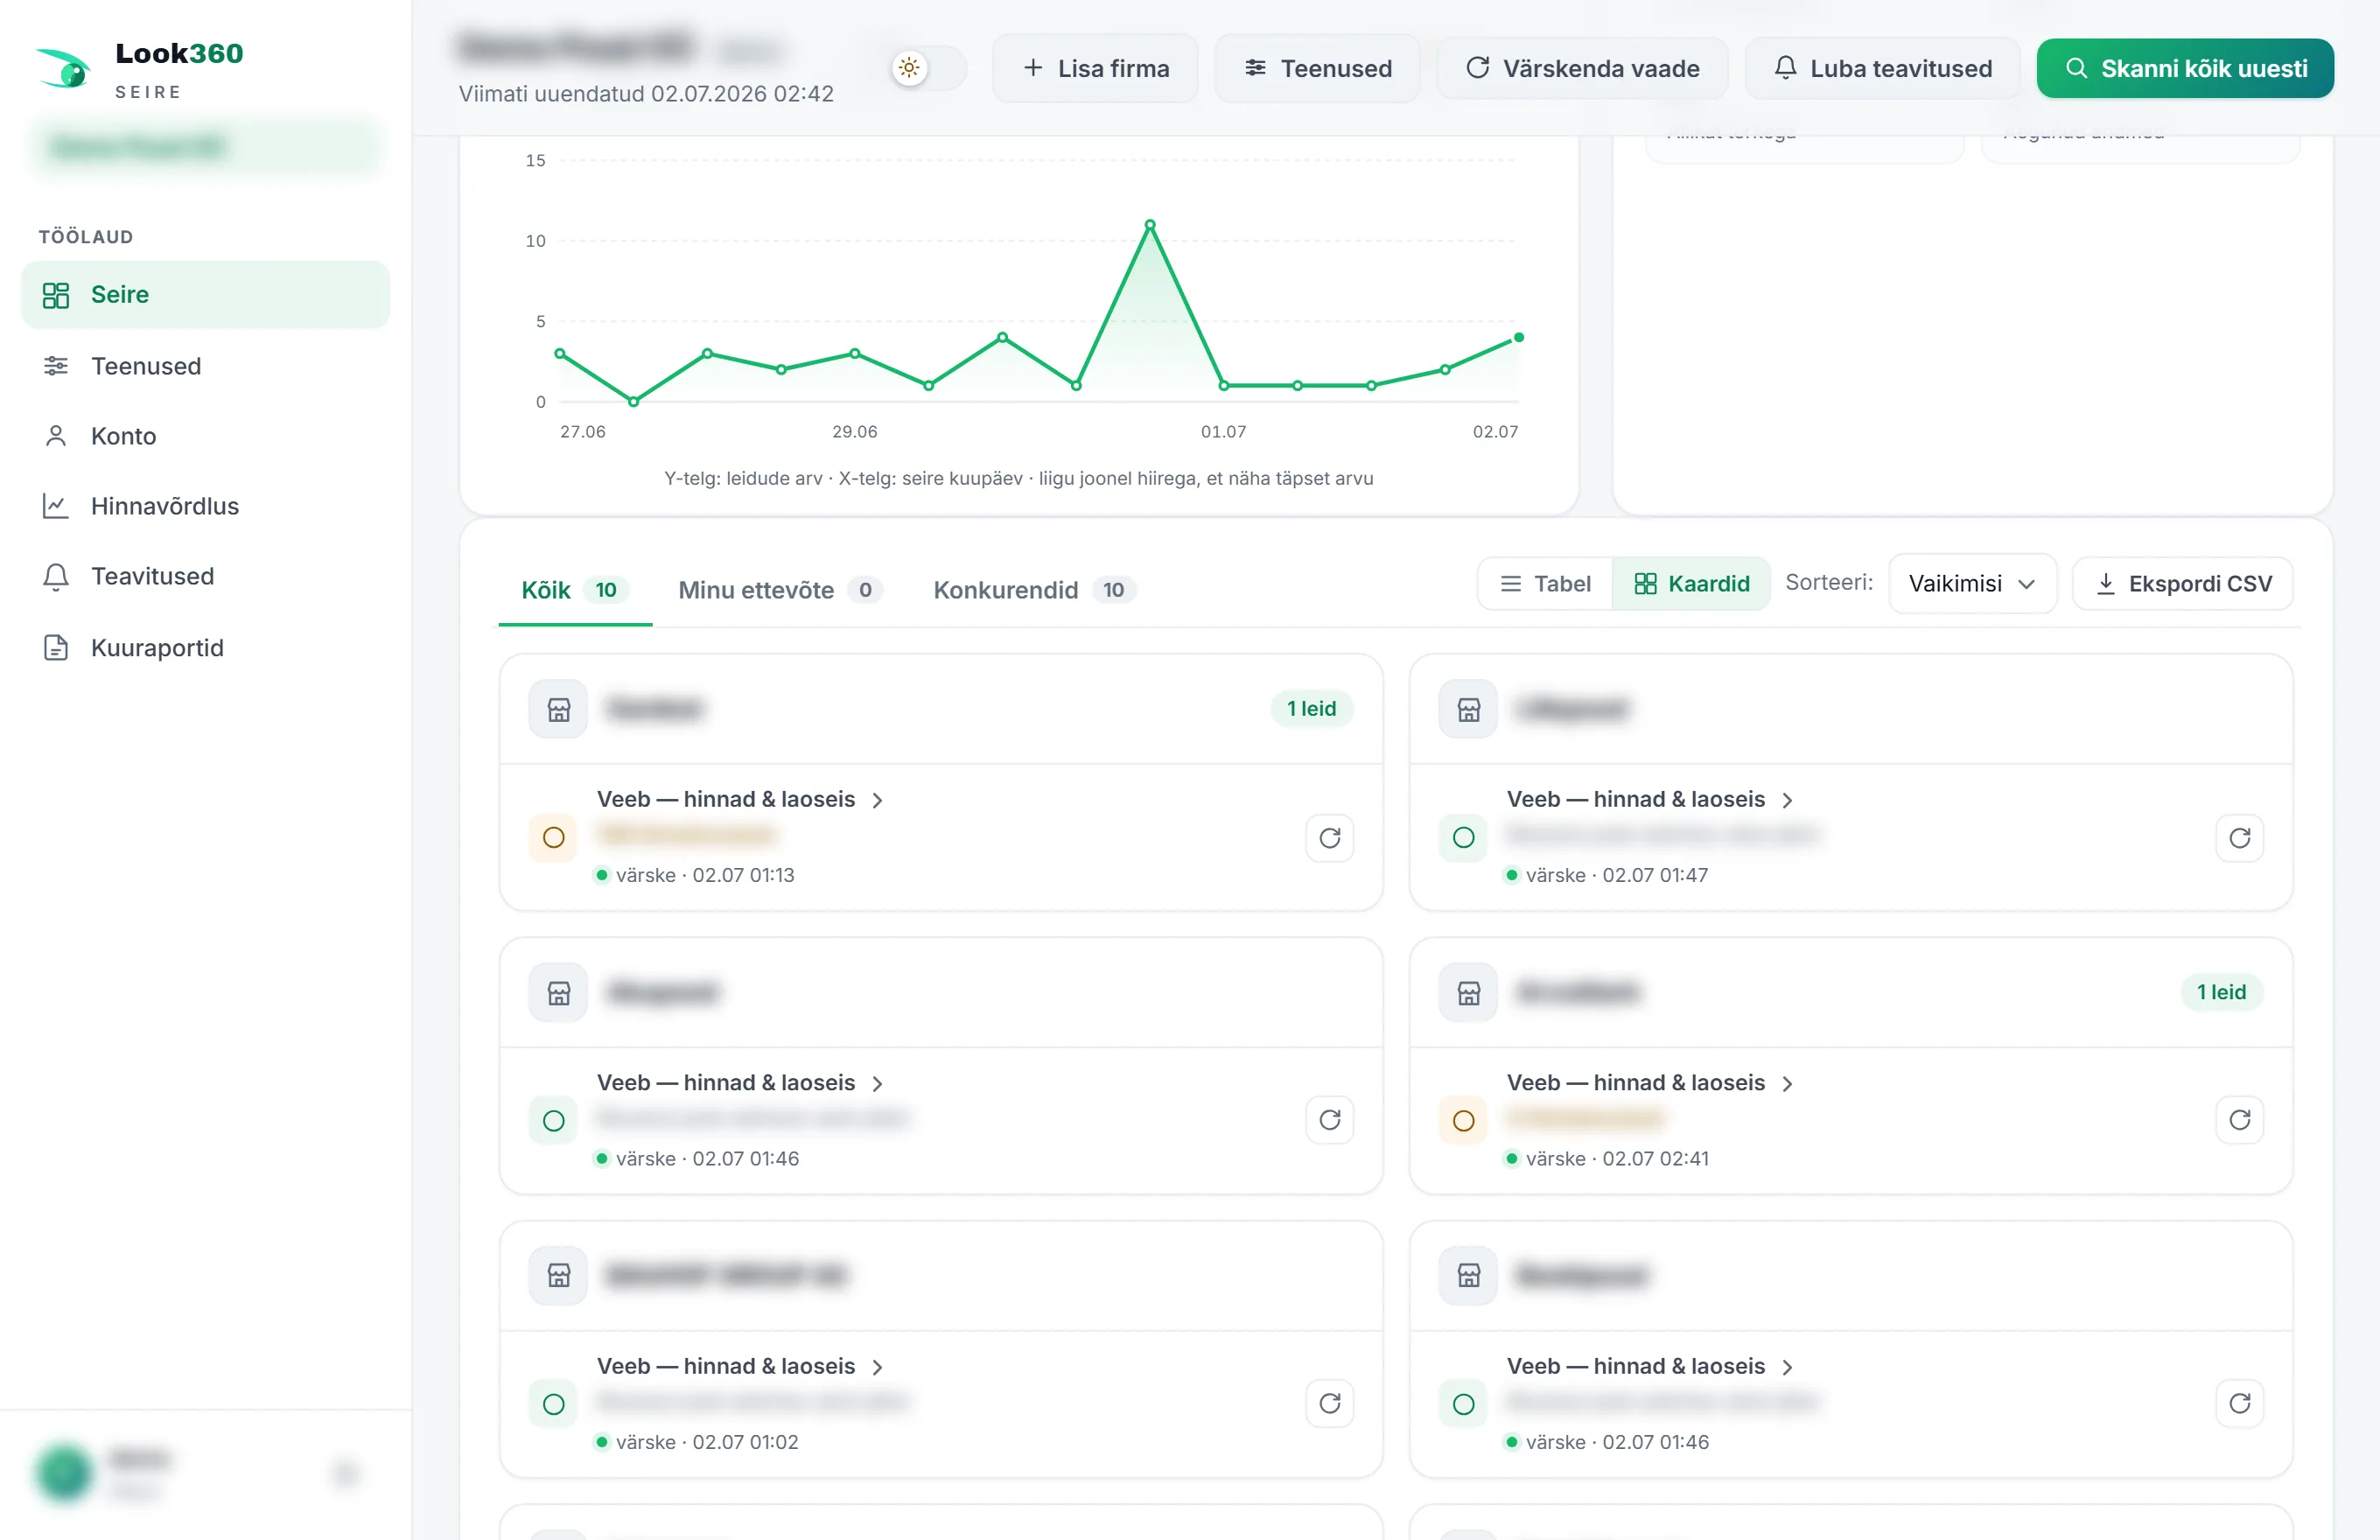
Company table
Each row is one monitored company. Click a row to open that company's full view. Columns:
Under a company's name you see a short change hint (e.g. "3 cheaper prices"), so you do not always have to click into the company to see what happened there.
Companies you have added
Once you have added a company yourself, you see its status. Possible states:
- Pending – awaiting operator approval.
- Building… / AI detecting… – the online-store reader is being set up automatically.
- Payment pending – the data is ready, the monthly fee needs to be confirmed (see Section 6).
- Rejected – the request was declined (the reason is stated).
- Active – the company is under monitoring.
Facebook monitoring, all findings and history
- Facebook monitoring – on a separate card, the latest posts from the competitors you monitor; a click takes you to the original.
- All findings – every change from the latest scan in a single list. The Warnings only checkbox hides the quiet part.
- Report history – earlier summary reports; a click opens the archived report.
5 Adding a company
On the dashboard, press Add company. A simple form opens.
- Company name – start typing and pick a company from the business register list (or type the name in manually).
- Website – the name without the https:// prefix is enough, e.g. weekend.ee.
- If you wish, turn on monitor the store's prices and stock and/or also monitor Facebook.
- Press Add company to monitor
If a company with the same name or web address is already on your list, the system lets you know – so there is no duplicate entry and no duplicate monthly fee.
Online-store monitoring
If you choose online-store monitoring, the system tries to read the store's products itself. On success, monitoring starts automatically; otherwise an operator reviews it. You can add a keyword filter: type a keyword and press Enter or + to add a chip (e.g. lawn mower). Left empty, we monitor all products.
Online-store monitoring costs €8 a month for every up to 2000 monitored products. All prices are excluding VAT. Once the system has read the store's products, you choose which categories to monitor yourself – this determines the number of products and the monthly fee. We show the exact amount and ask for confirmation before we open the data.
Facebook monitoring
Enter the Facebook page address – the page name or address is enough (e.g. facebook.com/competitor or simply competitor). If the page is not yet on the monitoring list, it goes to an operator for approval. Facebook monitoring costs €3 a month per competitor.
6 Company view and product catalogue
Clicking a company name on the dashboard opens its full view: all channels, findings, online-store health, charts and – for an online store – the entire product catalogue.
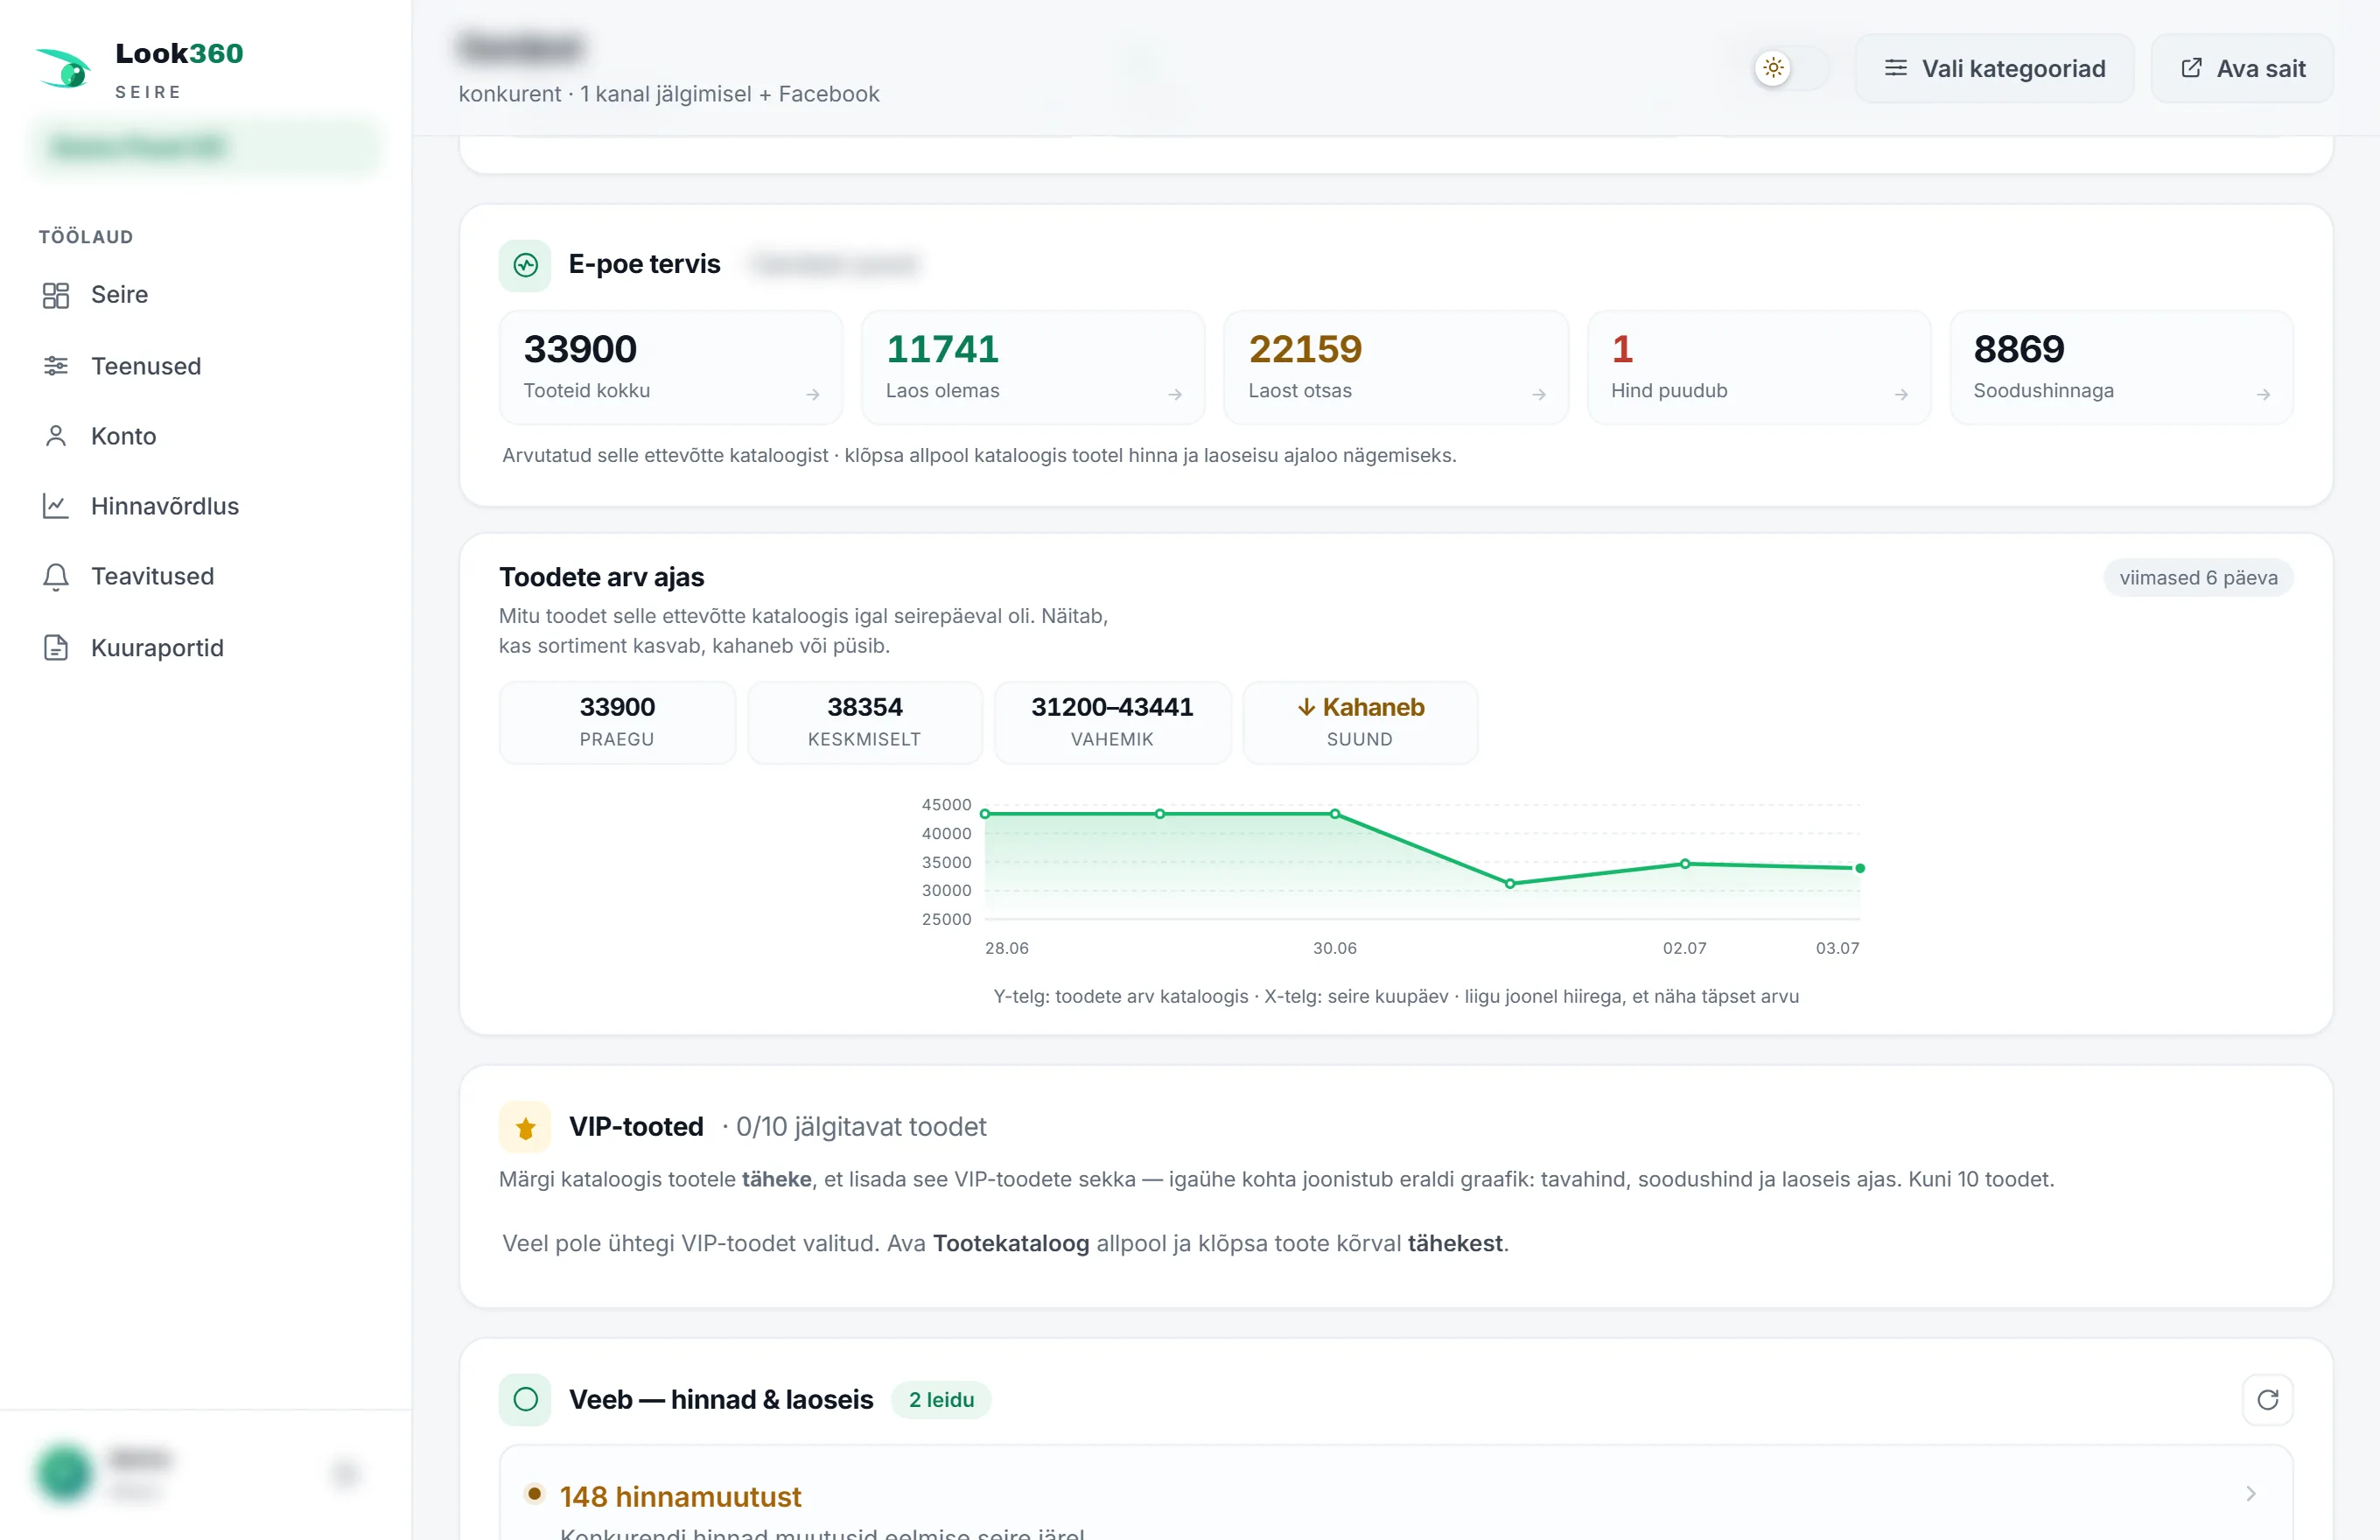
Online-store health
The card shows all at once: total products, in stock, out of stock, no price, on sale and stock unknown. The numbers are calculated from that store's catalogue and are clickable.
Product count over time
The chart shows how many products were in the store's catalogue on each monitoring day – whether the assortment is growing, shrinking or holding steady. Alongside are now, average, range and direction.
VIP products
In the catalogue, mark a product with a star to add it to your VIP products. A separate chart is drawn for each VIP product: the regular price, the sale price and stock over time. Up to 10 products at a time – keep an eye on the ones that matter most to you.
Header buttons
- Choose categories – choose which of the store's categories to monitor (see Section 7).
- Open site – opens the competitor's online store in a new window.
Confirming the monthly fee
Once the store's products have been read, you see a calculator: number of products, tiers (× up to 2000 products), base price €8 and total monthly fee. Until you confirm, the catalogue is shown as a sample and is blurred. Options:
- Pay and open the data – we send you to a secure payment gateway (bank link or card); the data opens straight away.
- Pay by invoice – we email you an invoice; the content opens once the payment has arrived.
- Choose categories – reduce the products to lower the monthly fee.
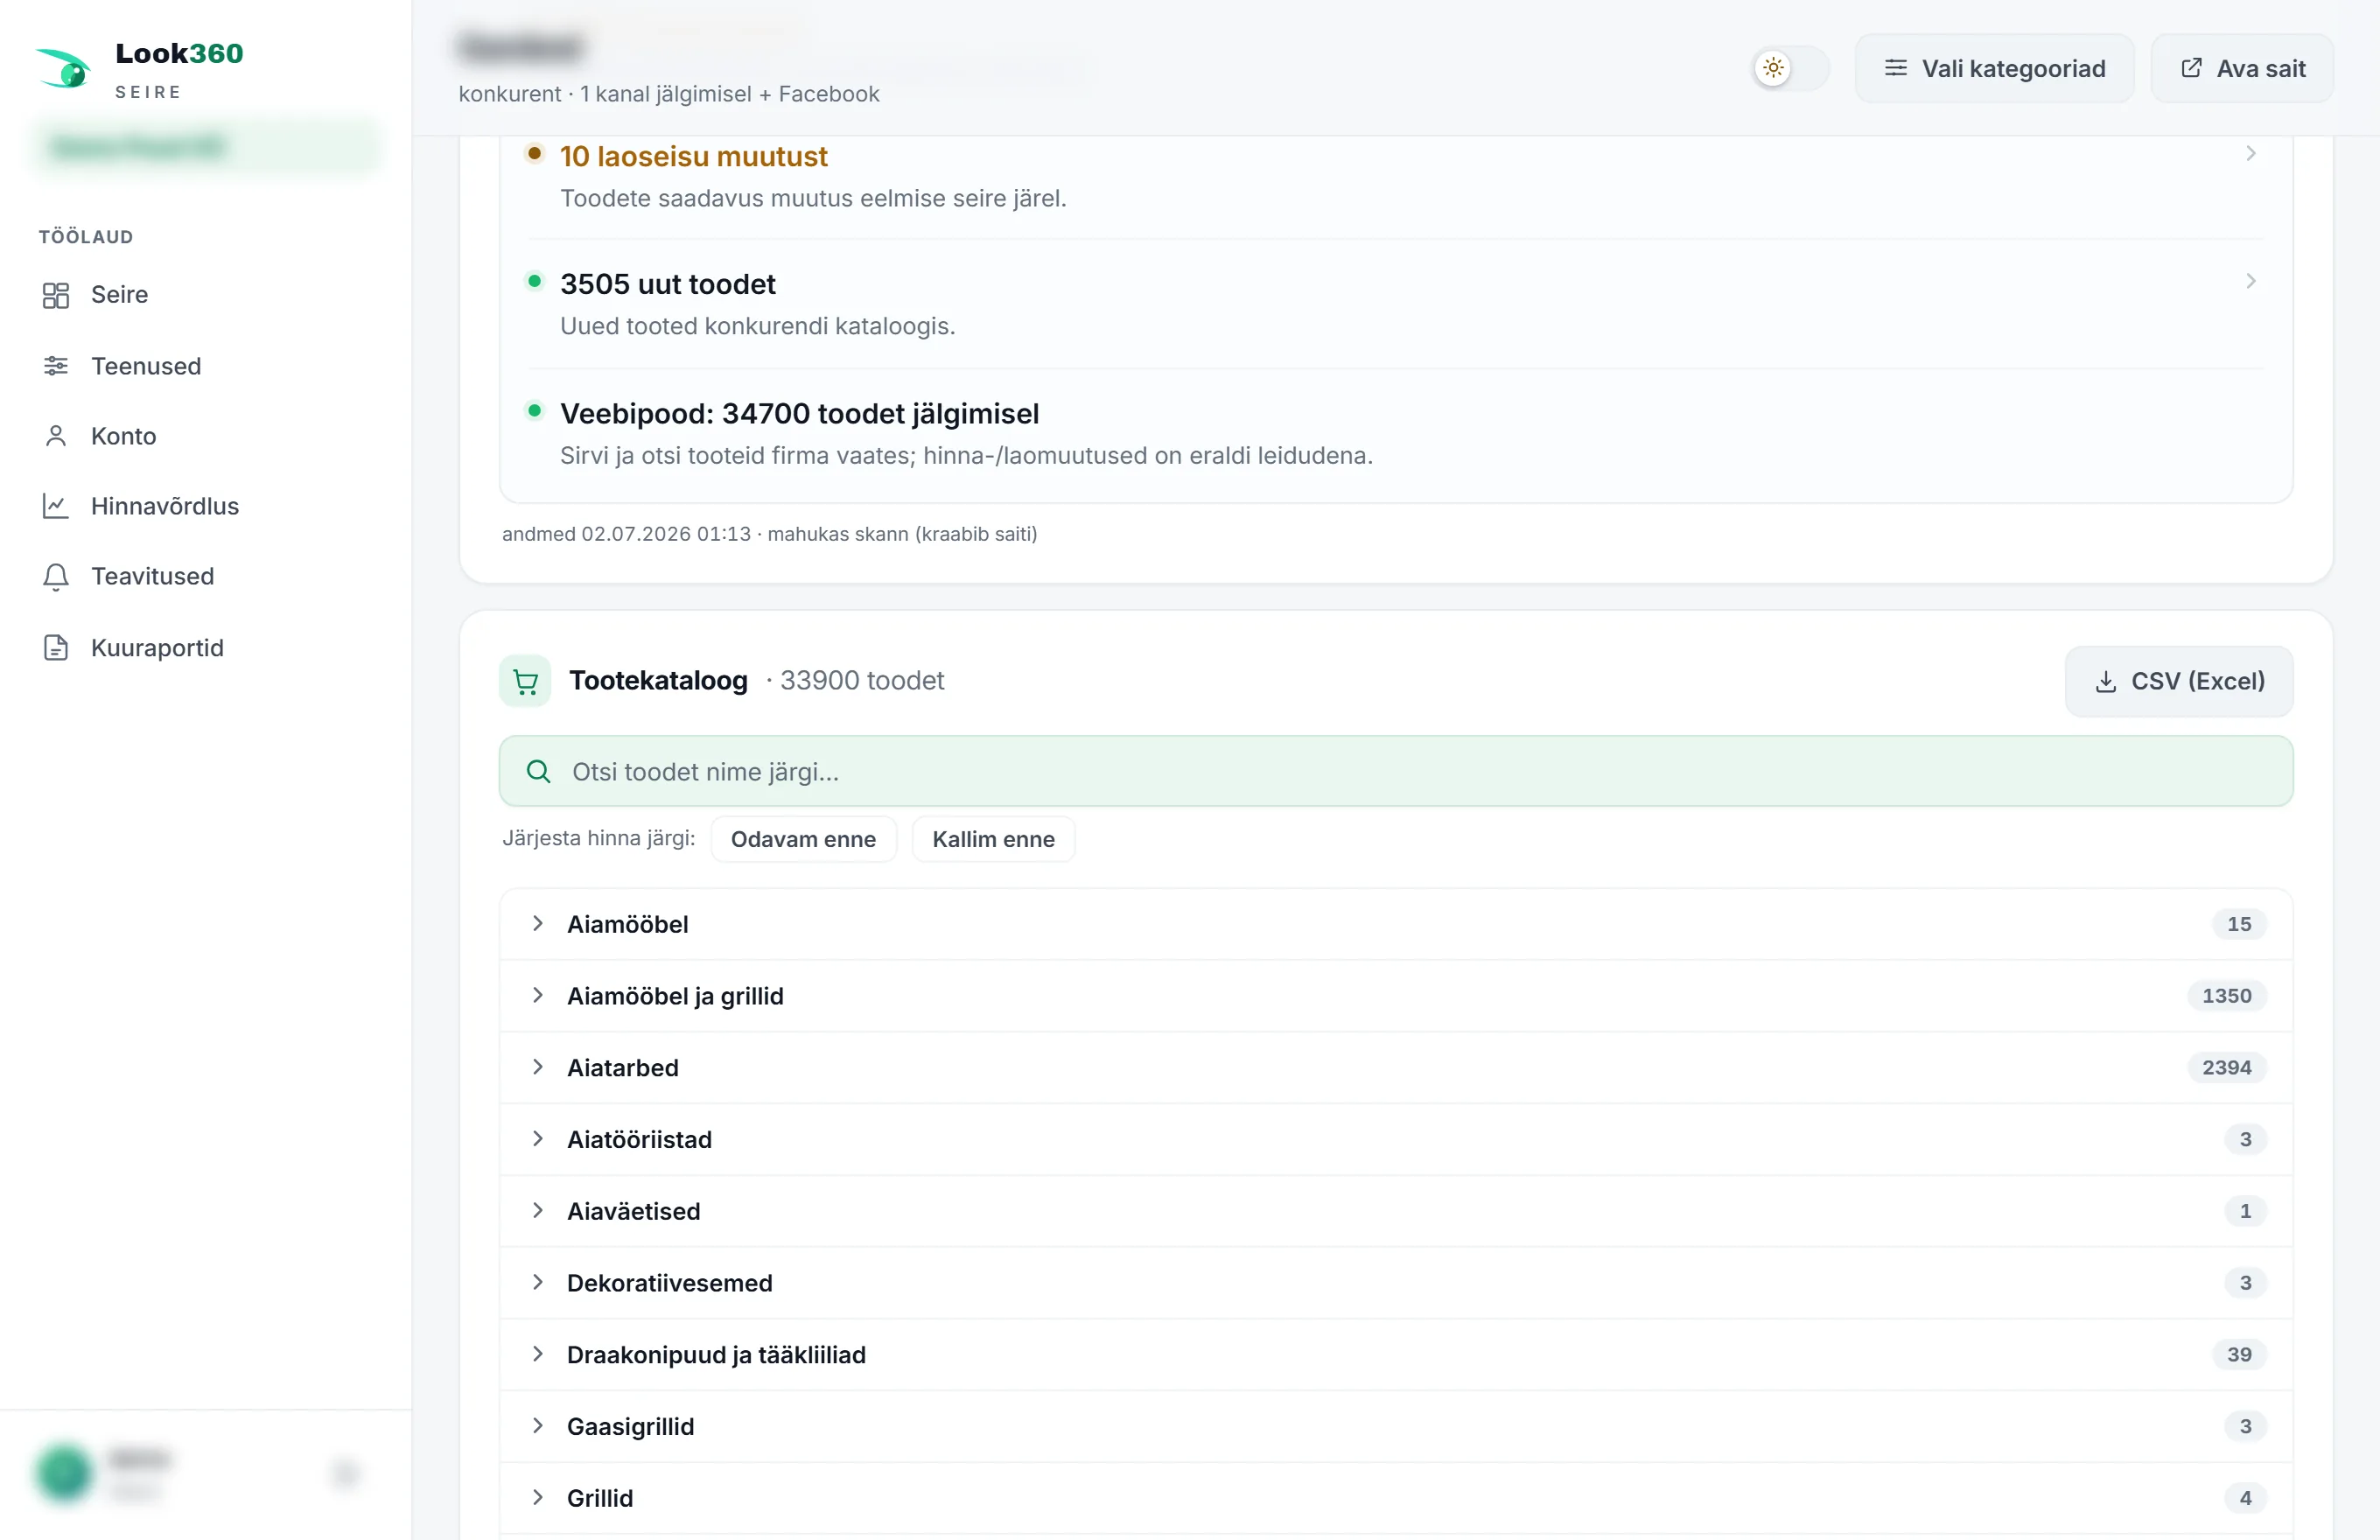
Product catalogue
- Search – type a product name to filter the list.
- Categories – click a category to open its subcategories and products.
- Stock – for each product, in stock, out of stock or unknown.
- Price – for a sale price you see the regular price struck through and the sale price in red.
- A star adds the product to the VIP list; a bell creates a price notification straight away; an arrow takes you to the product in the store.
Price and stock history
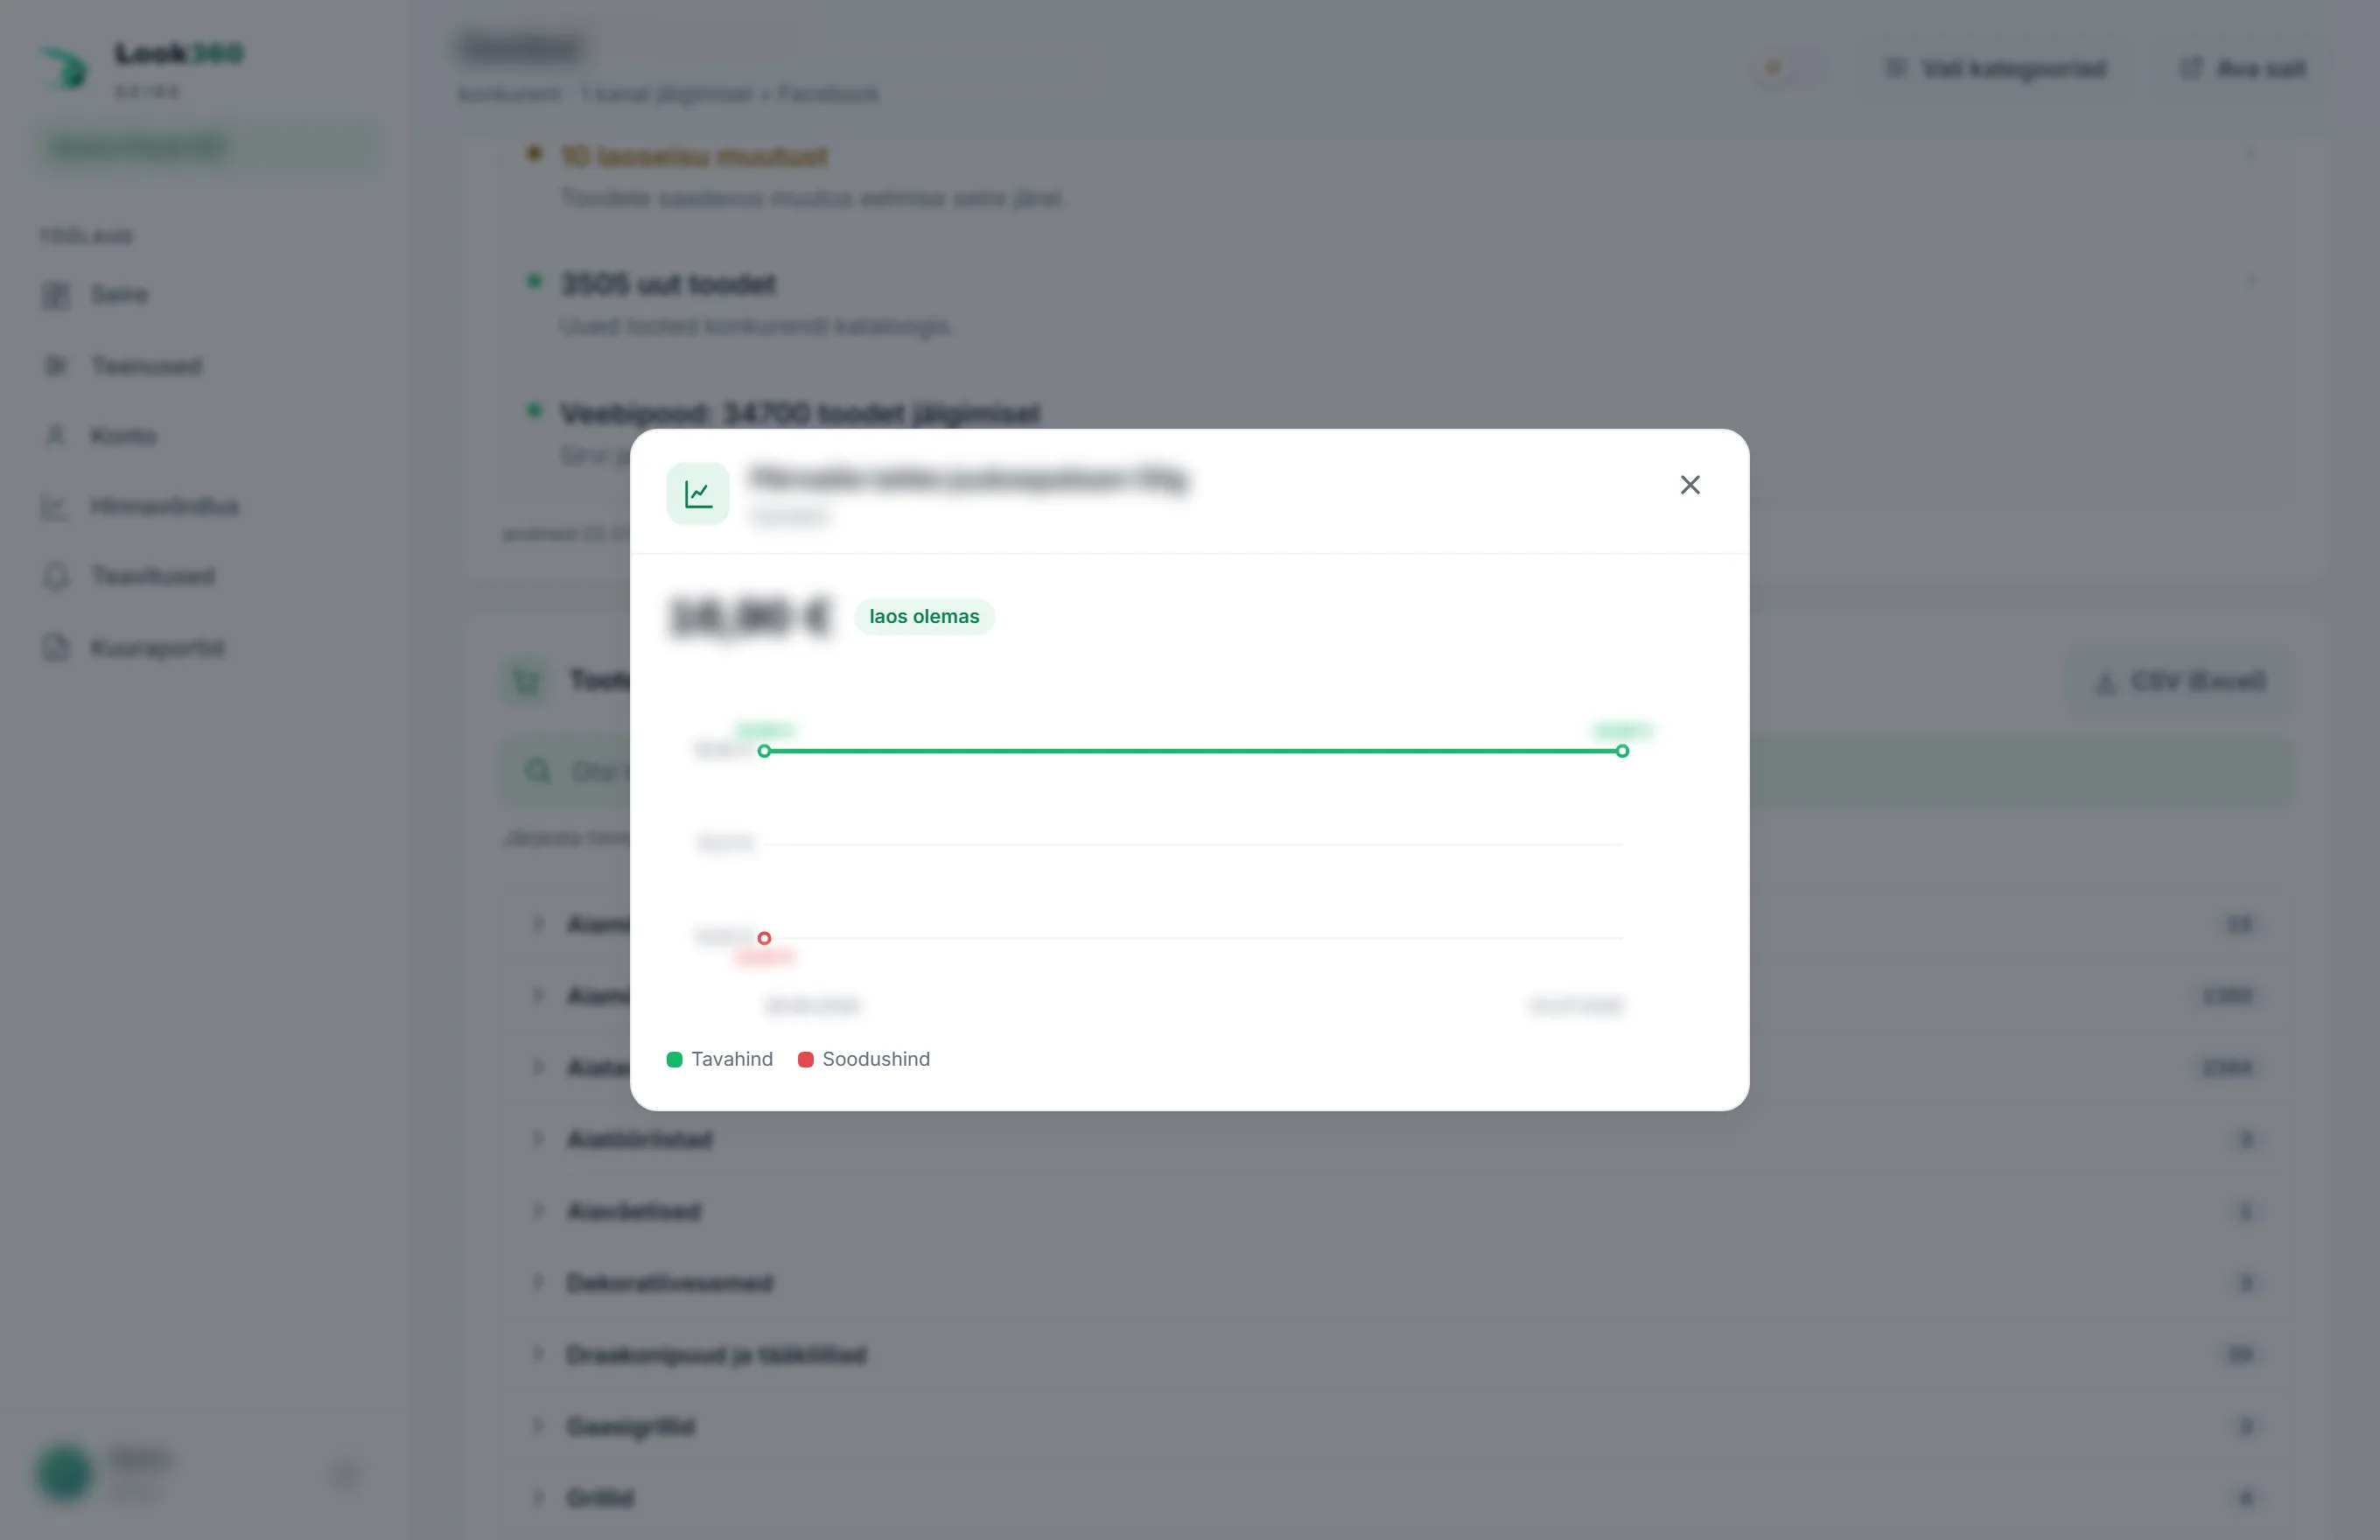
Clicking a product row opens a chart window: the current price and discount, the regular price and sale price over time, and stock. A legend below explains the lines.
7 Choosing categories
The Choose categories button opens a list of all the store's categories. The fewer products you choose, the lower the monthly fee.
- Tick the categories you want to monitor. Select all, Clear selection and search help.
- Watch the calculator below: selected products → tiers (× up to 2000) → the monthly fee updates instantly.
- Press Save selection
You can change the selection again at any time – the monthly fee adjusts accordingly.
8 Price comparison
The Price comparison menu item takes the same product across all monitored stores and shows where it is cheapest and how the price has moved over time. Products are matched by model code and size.
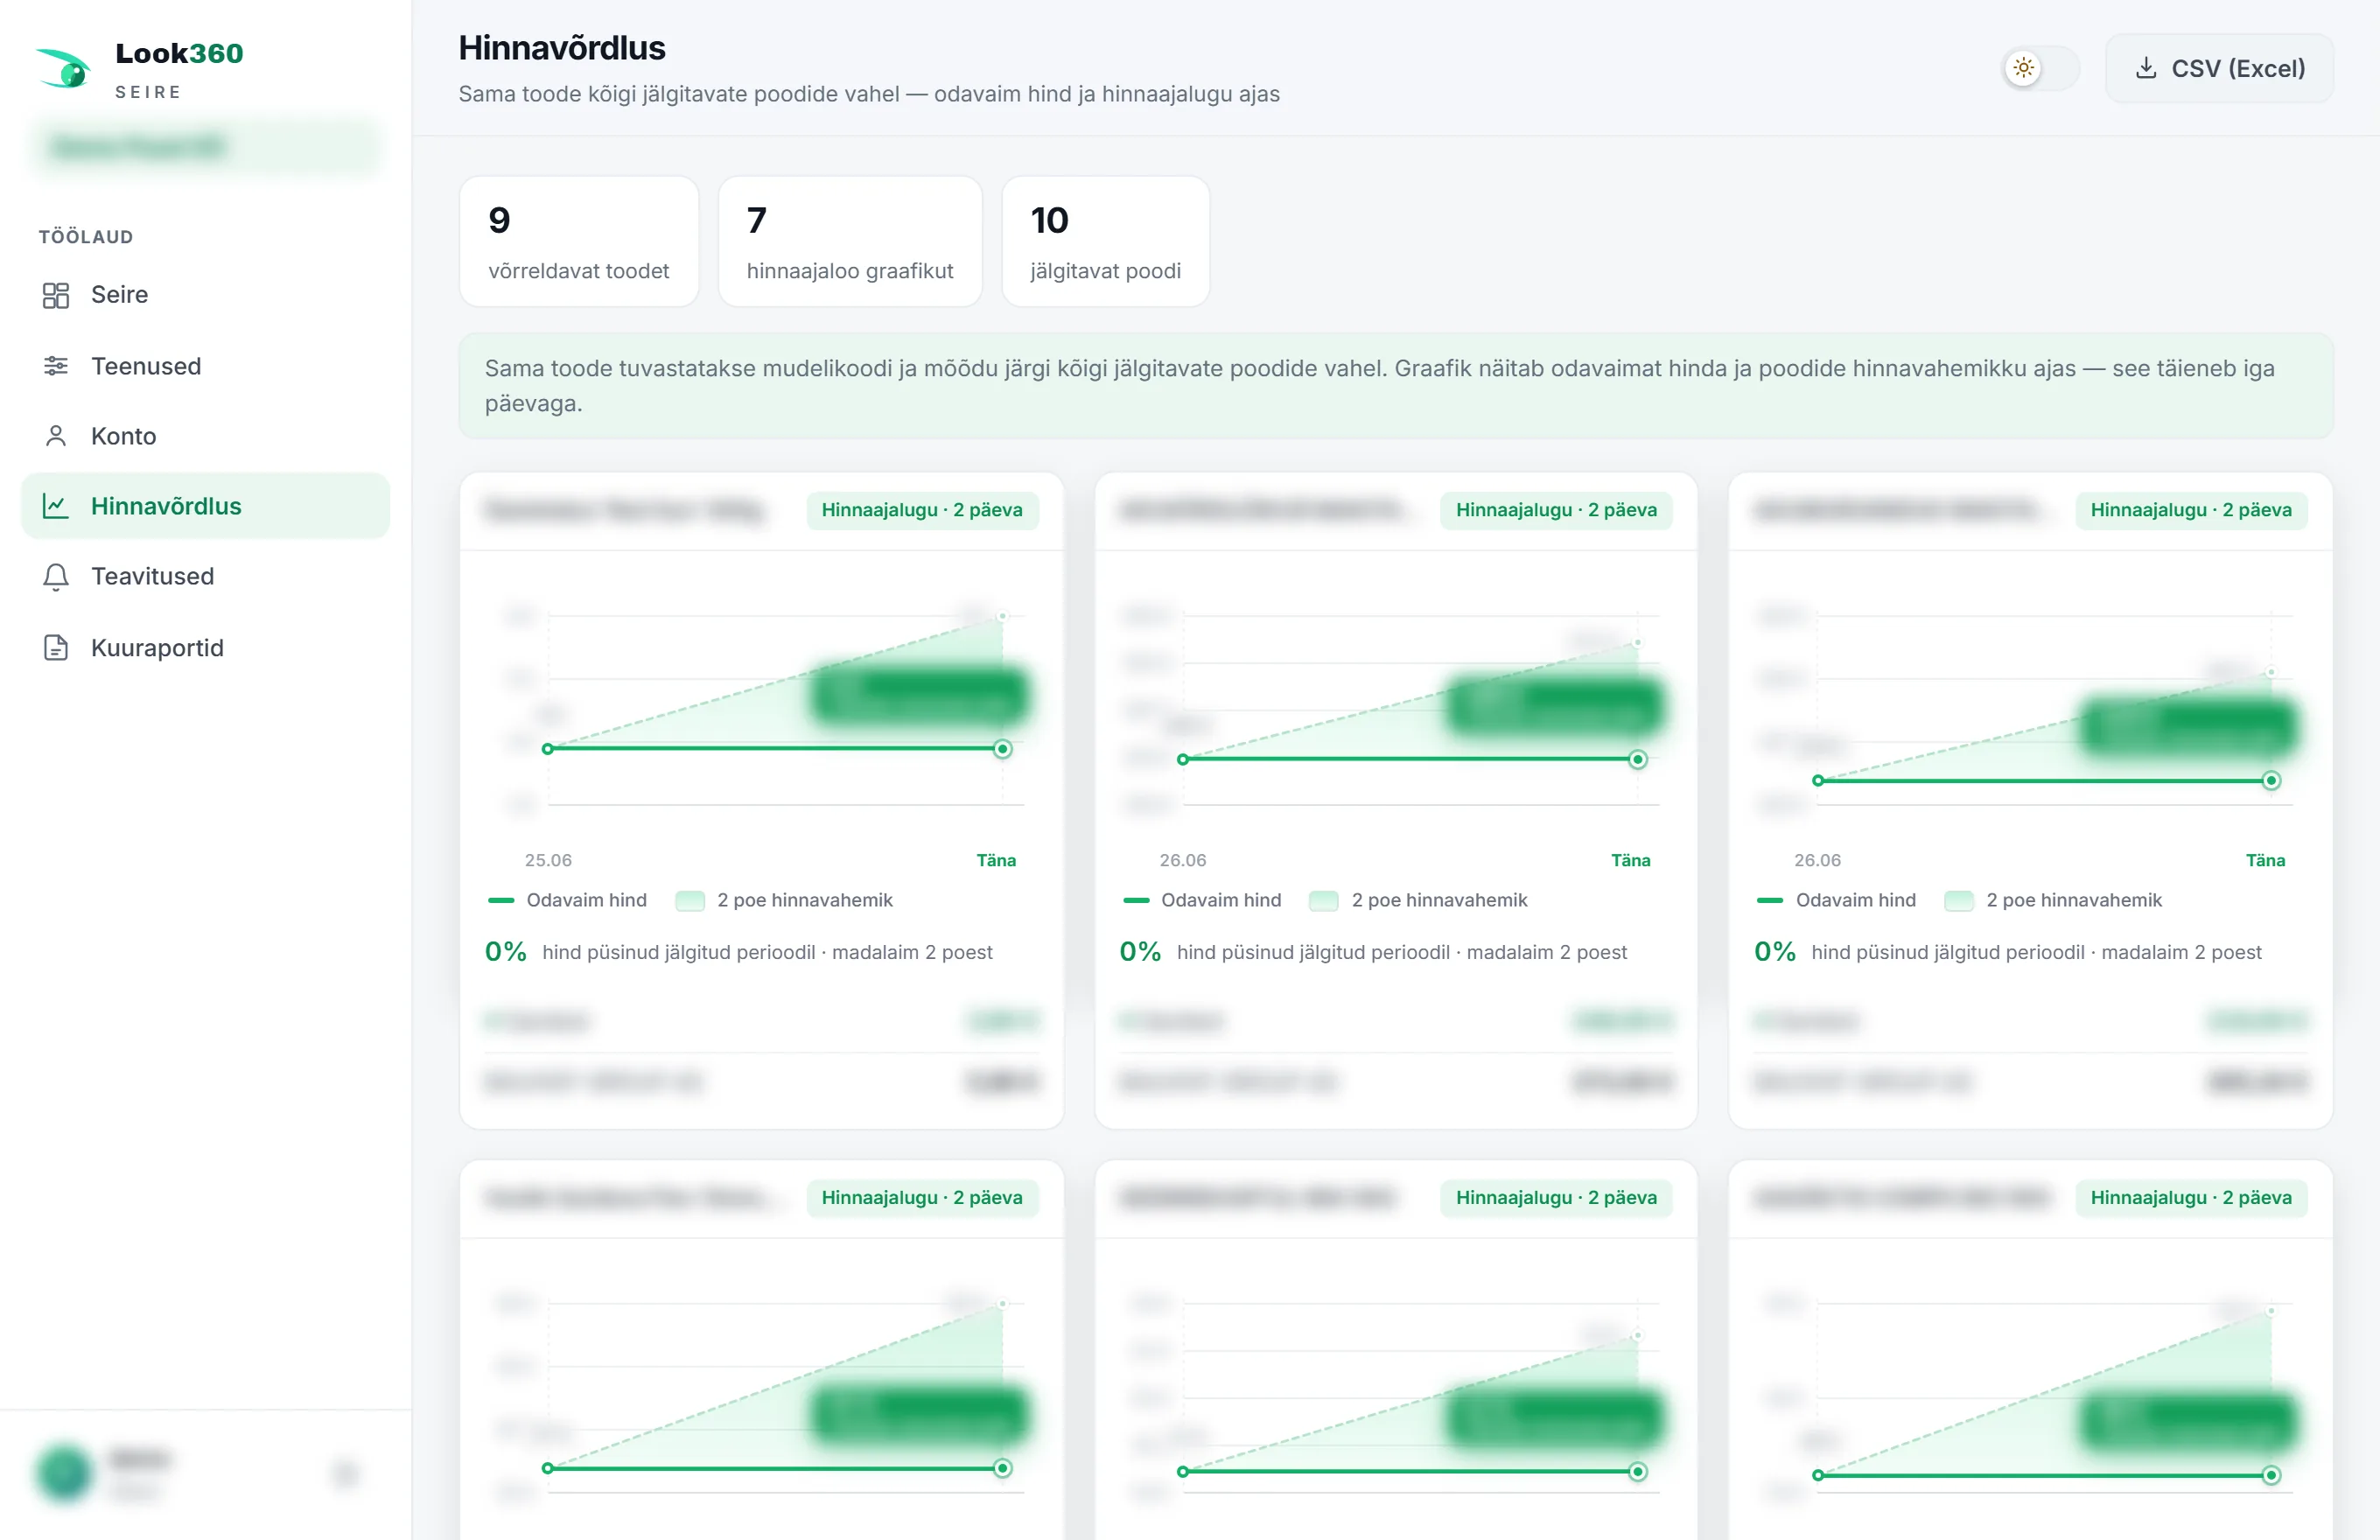
- At the top is a summary: comparable products, price-history charts and monitored stores.
- Each card shows the cheapest price, the range of store prices over time and today's cheapest store.
- Below is stated by how many per cent the price has changed over the monitored period and out of how many stores the cheapest was found.
- CSV (Excel) downloads the whole comparison.
You see at once whether you are the most expensive or the cheapest on the market for a product – a good input for pricing (Section 14) and campaigns.
9 Notifications
The Notifications menu item lets you set rules that, when met, trigger an immediate alert – as a push notification to your phone and/or by email.
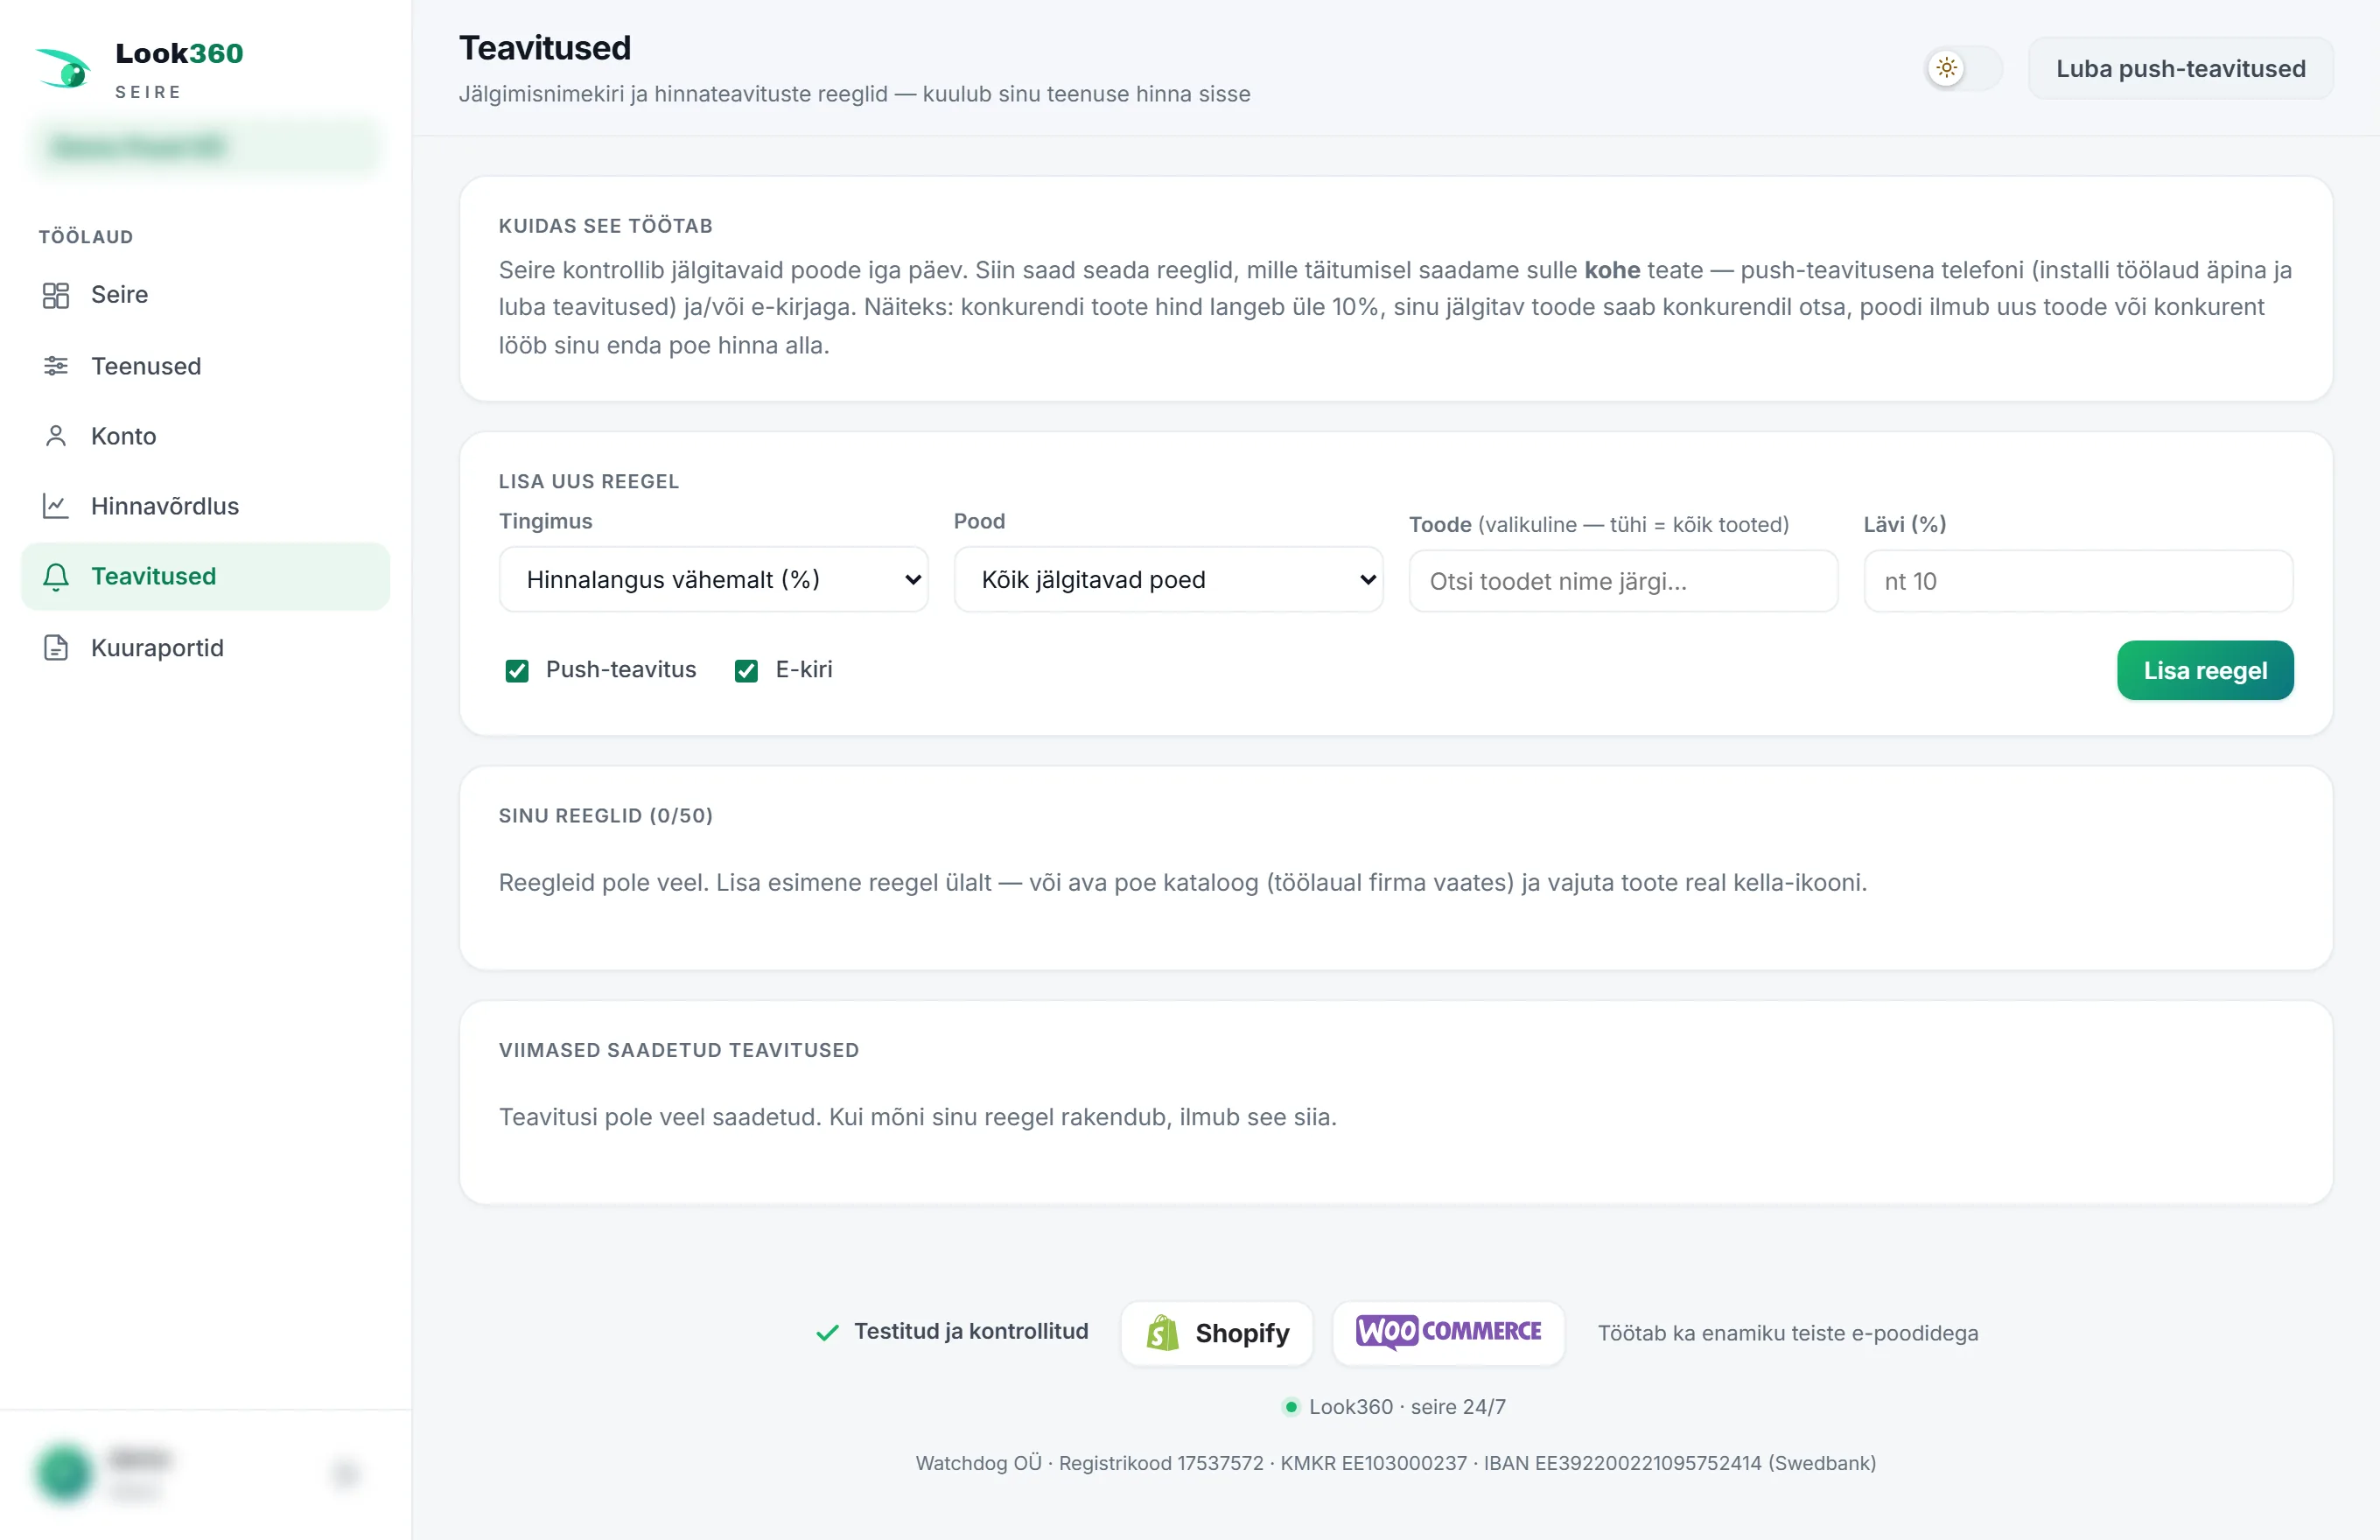
- Choose a condition – e.g. a price drop of at least X%, out of stock, a new product, a competitor going below your price.
- Choose a store (all monitored or one specific one) and, if you wish, a specific product.
- Set the threshold (%) if the condition requires one.
- Tick Push notification and/or Email and press Add rule
- A rule can be temporarily switched off or deleted at any time.
- The quickest way to create a notification is straight from the catalogue or the price comparison – the bell icon on a product row pre-fills the form.
- To receive push alerts, press Enable push notifications at the top (on iPhone after installing as an app – see Section 17).
10 Monthly reports
The Monthly reports menu item brings together, on the 1st of each month for the previous month, a PDF summary for management: price changes, assortment movement, your price position on the market and brand-monitoring breaches.
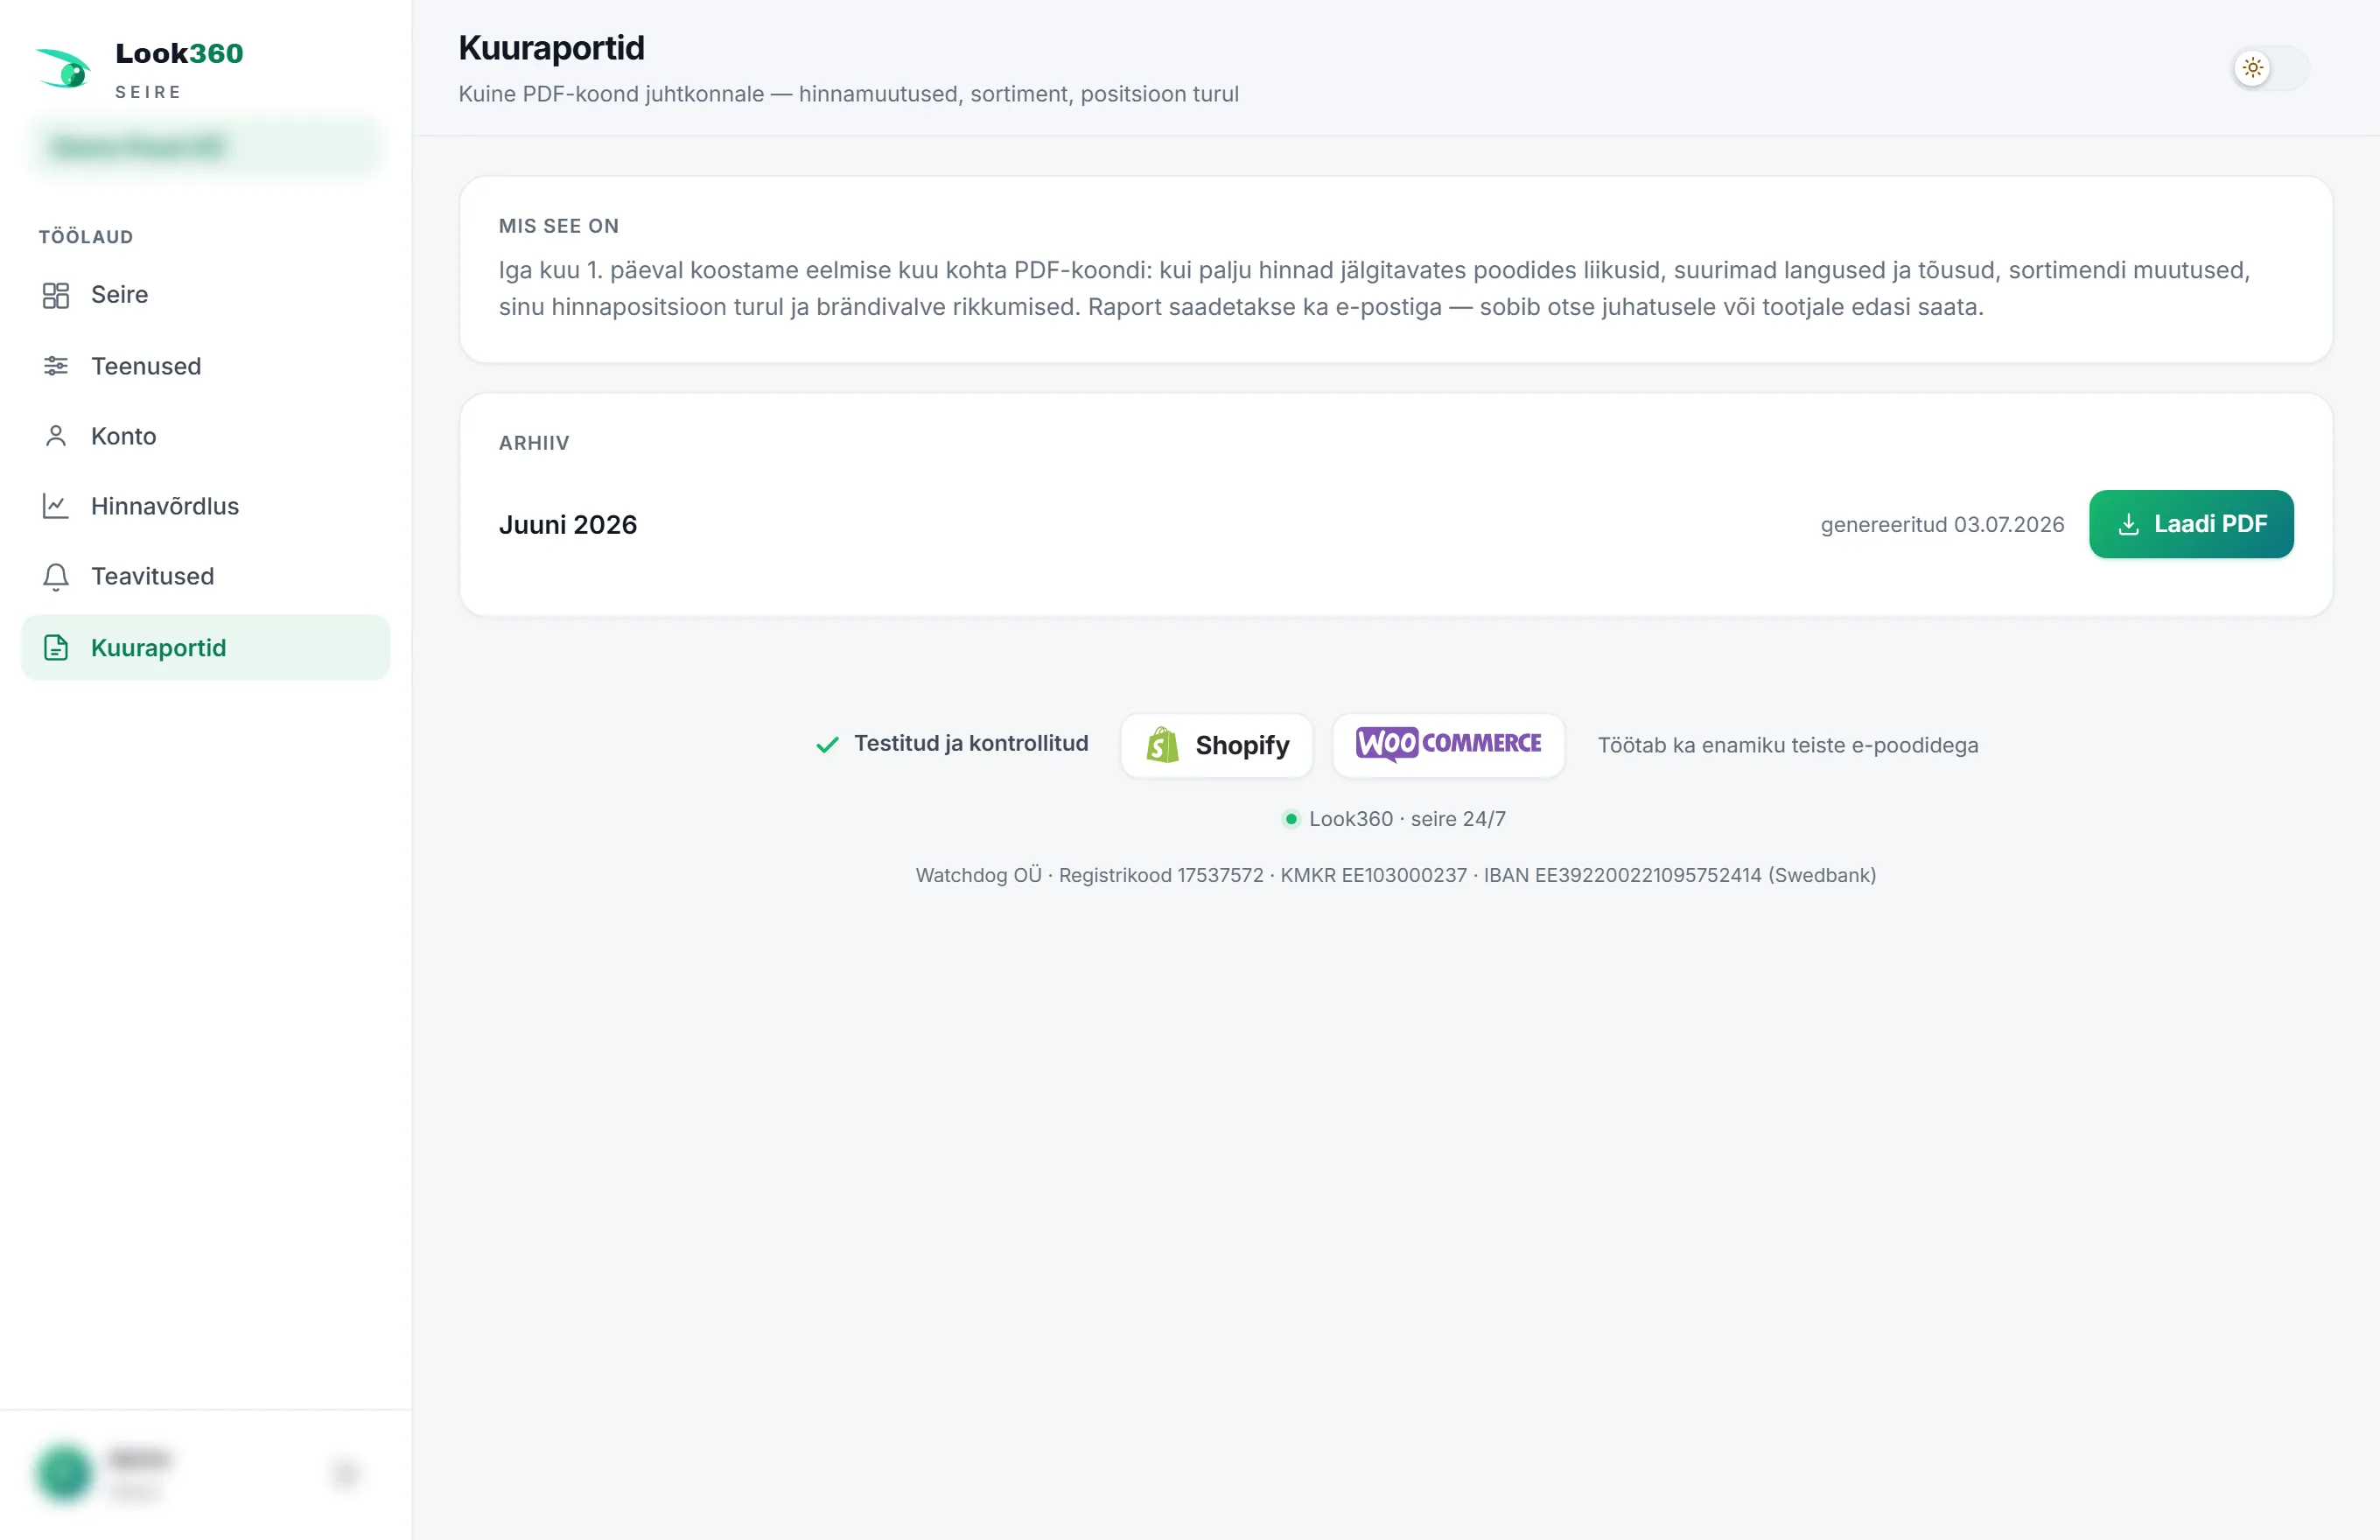
- Automatic – the report is produced and emailed at the start of each month; nothing needs to be done by hand.
- Archive – all earlier monthly reports are here to download.
- The email can be switched off on the Account page – the PDF is still produced and kept in the archive, only the email is then not sent.
- Unlike the daily email (see below), the monthly report is a summary overview for decision-makers, not a daily list of changes.
The daily email and real-time alerts
- Daily email – the more important changes reach your (and the agreed contacts') inbox automatically. It can be switched on/off on the Account page.
- Real-time alerts – the most critical items (e.g. a competitor's price drop, an online-store outage, a stockout) arrive straight away via the notification rules.
11 Account and API access
The Account menu item brings together your account details, your online-store connection, email report settings and API access.
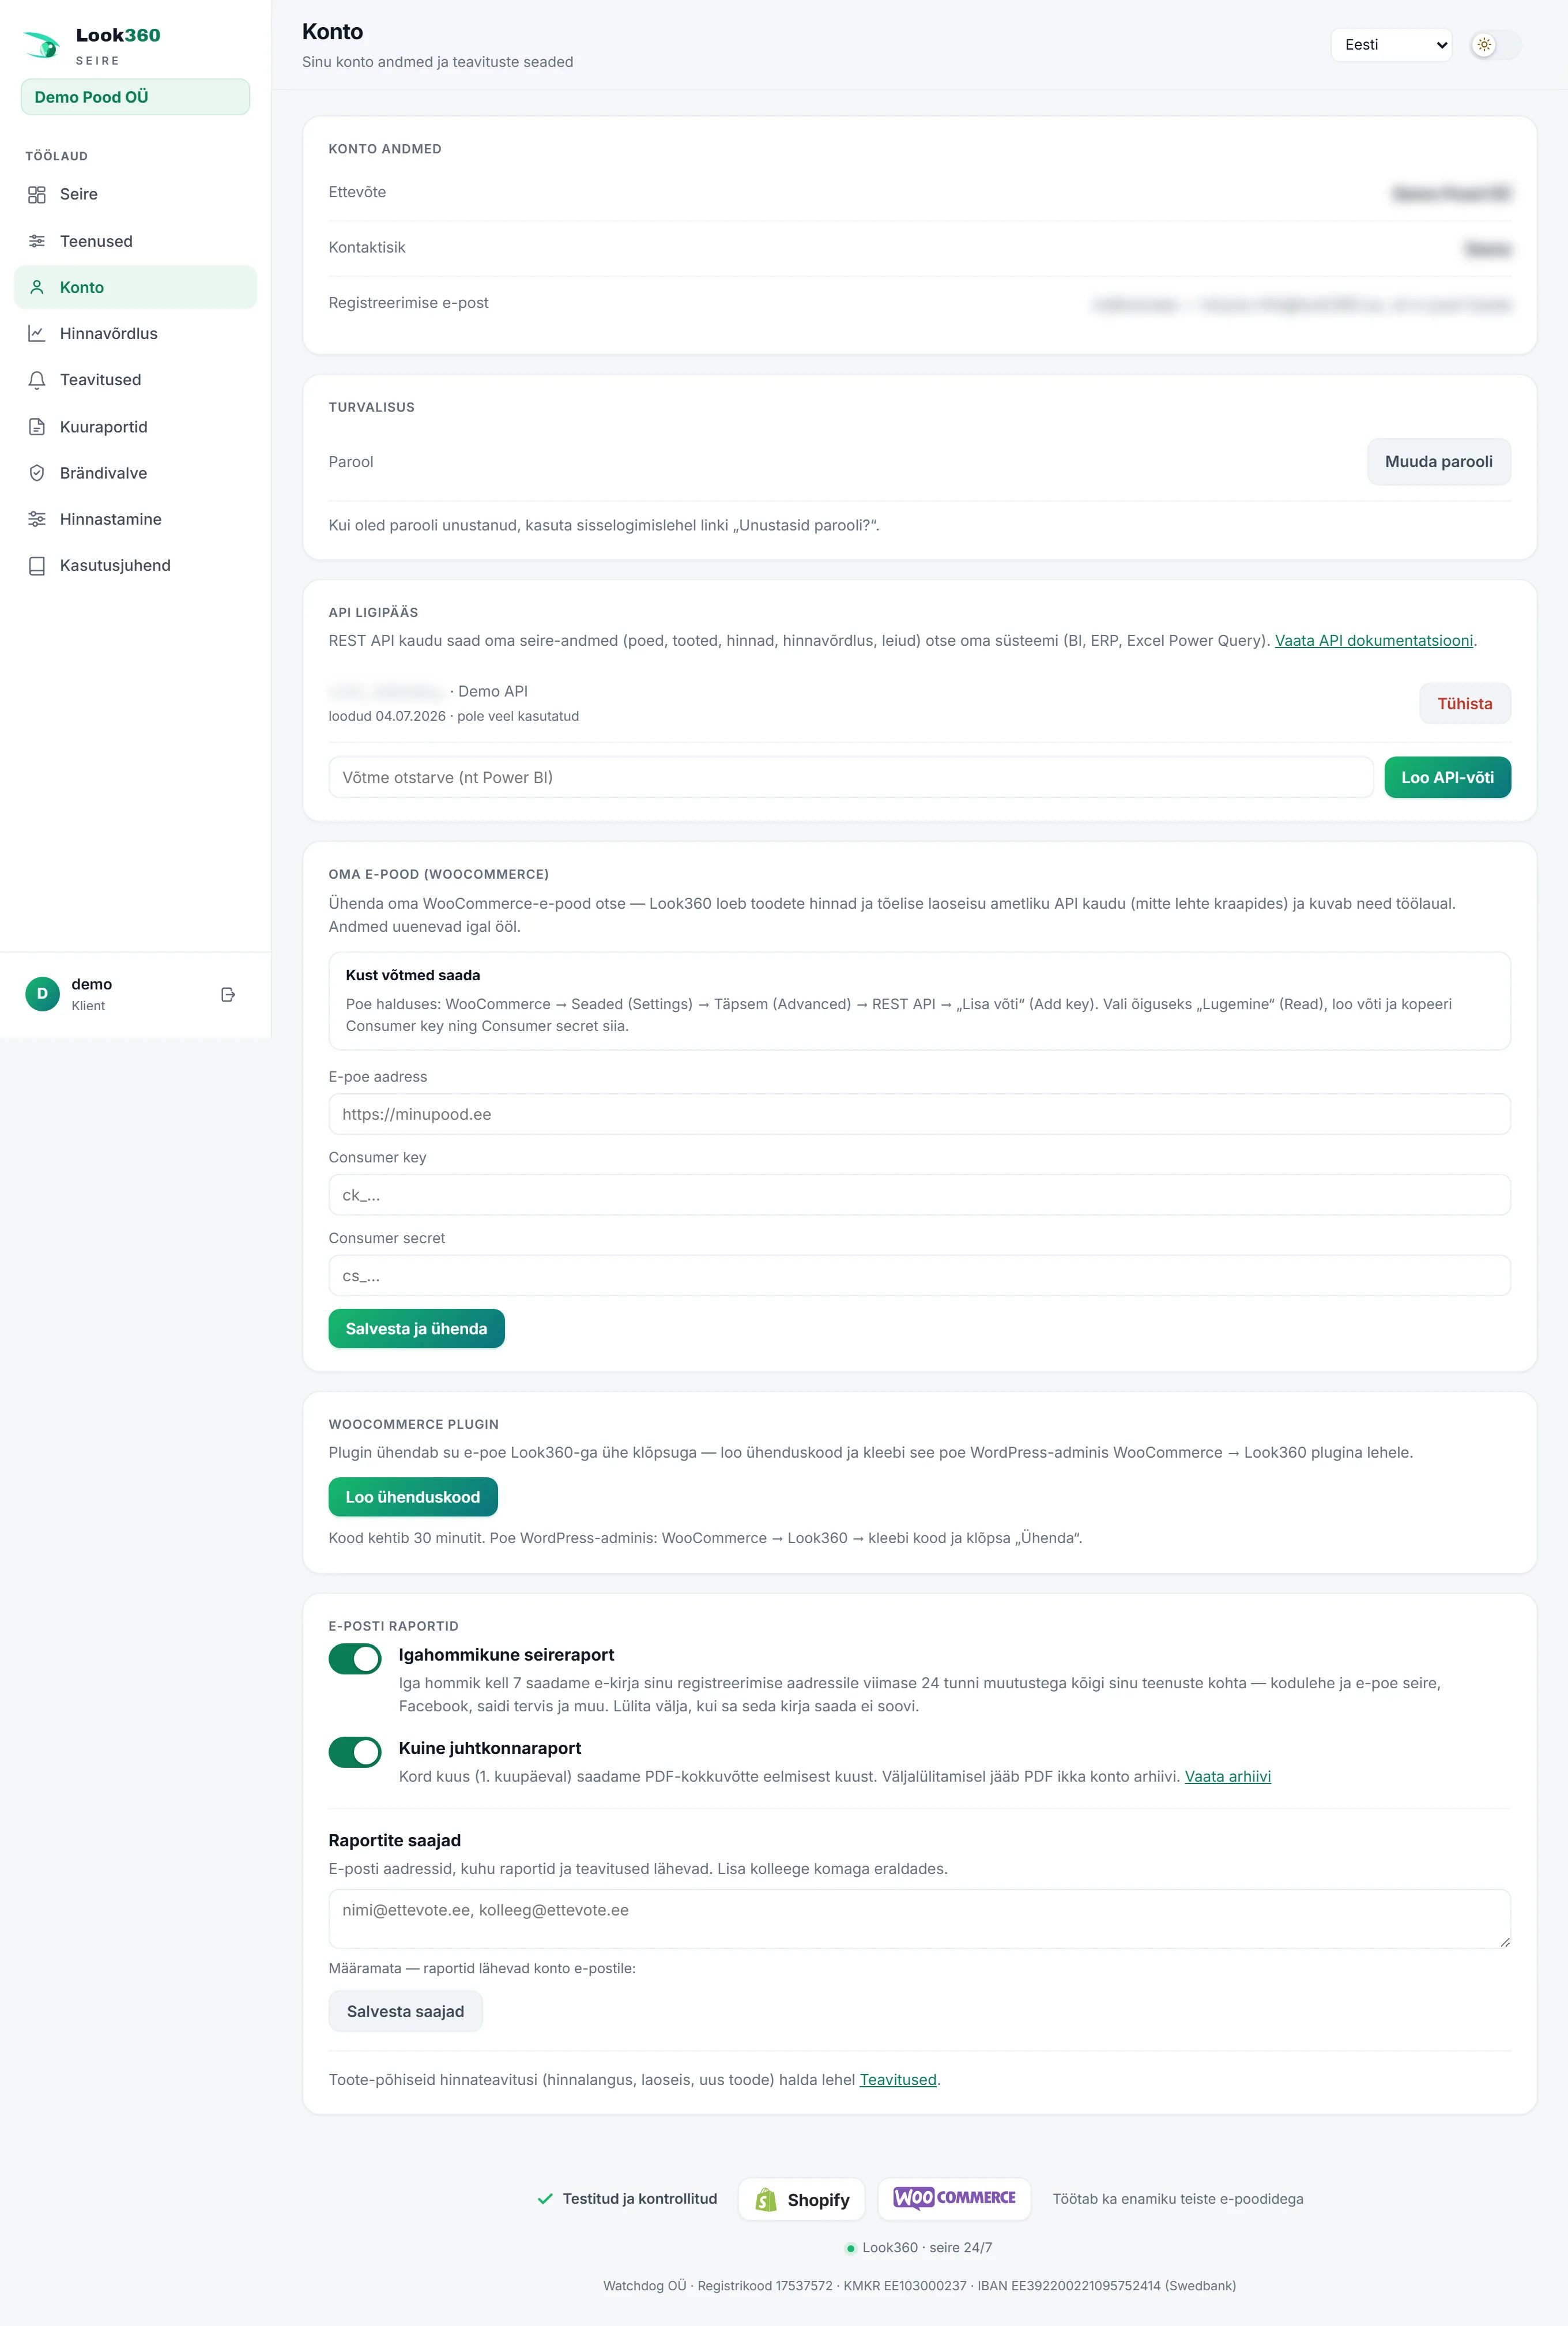
- Account details – company, contact person and the registration email.
- Password – Change password; a forgotten password can be reset from the sign-in page.
Connecting your online store (WooCommerce)
So that your own store's services – online-store health, the health check and pricing – get real data, connect your WooCommerce store. Look360 reads the prices and the true stock via the official API (not by scanning the page), and they refresh every night. There are two ways to connect:
- Directly with an API key – in the store's admin WooCommerce → Settings → Advanced → REST API → Add key, with permission Read. Copy the Consumer key, Consumer secret and the online-store address into the form on the account page.
- With the Look360 plugin – the simpler route, without copying keys by hand: press Create connection code, open the WooCommerce → Look360 plugin page in the store's admin and paste the code. The code is valid for 30 minutes.
Once the store is connected, you see a green marker "Store connected". The data refreshes every night; the keys can be changed later via the same form.
Email reports
From one place you manage which reports go out by email, and to whom:
Manage product-based price notifications (price drop, stock, new product) separately on the Notifications page (Section 9).
API access (BI, ERP, Excel)
Through the REST API you can bring your monitoring data – stores, products, prices, price comparison, findings – straight into your own system (Power BI, ERP, Excel Power Query).
- Write the key's purpose (e.g. "Power BI") and press Create API key
- Copy the key straight away – it is shown only once.
- See the API documentation link for which endpoints are available.
12 All services and monthly fee
From the Services menu you see everything you pay for and can order more. At the top are your total monthly fee and the next billing date.
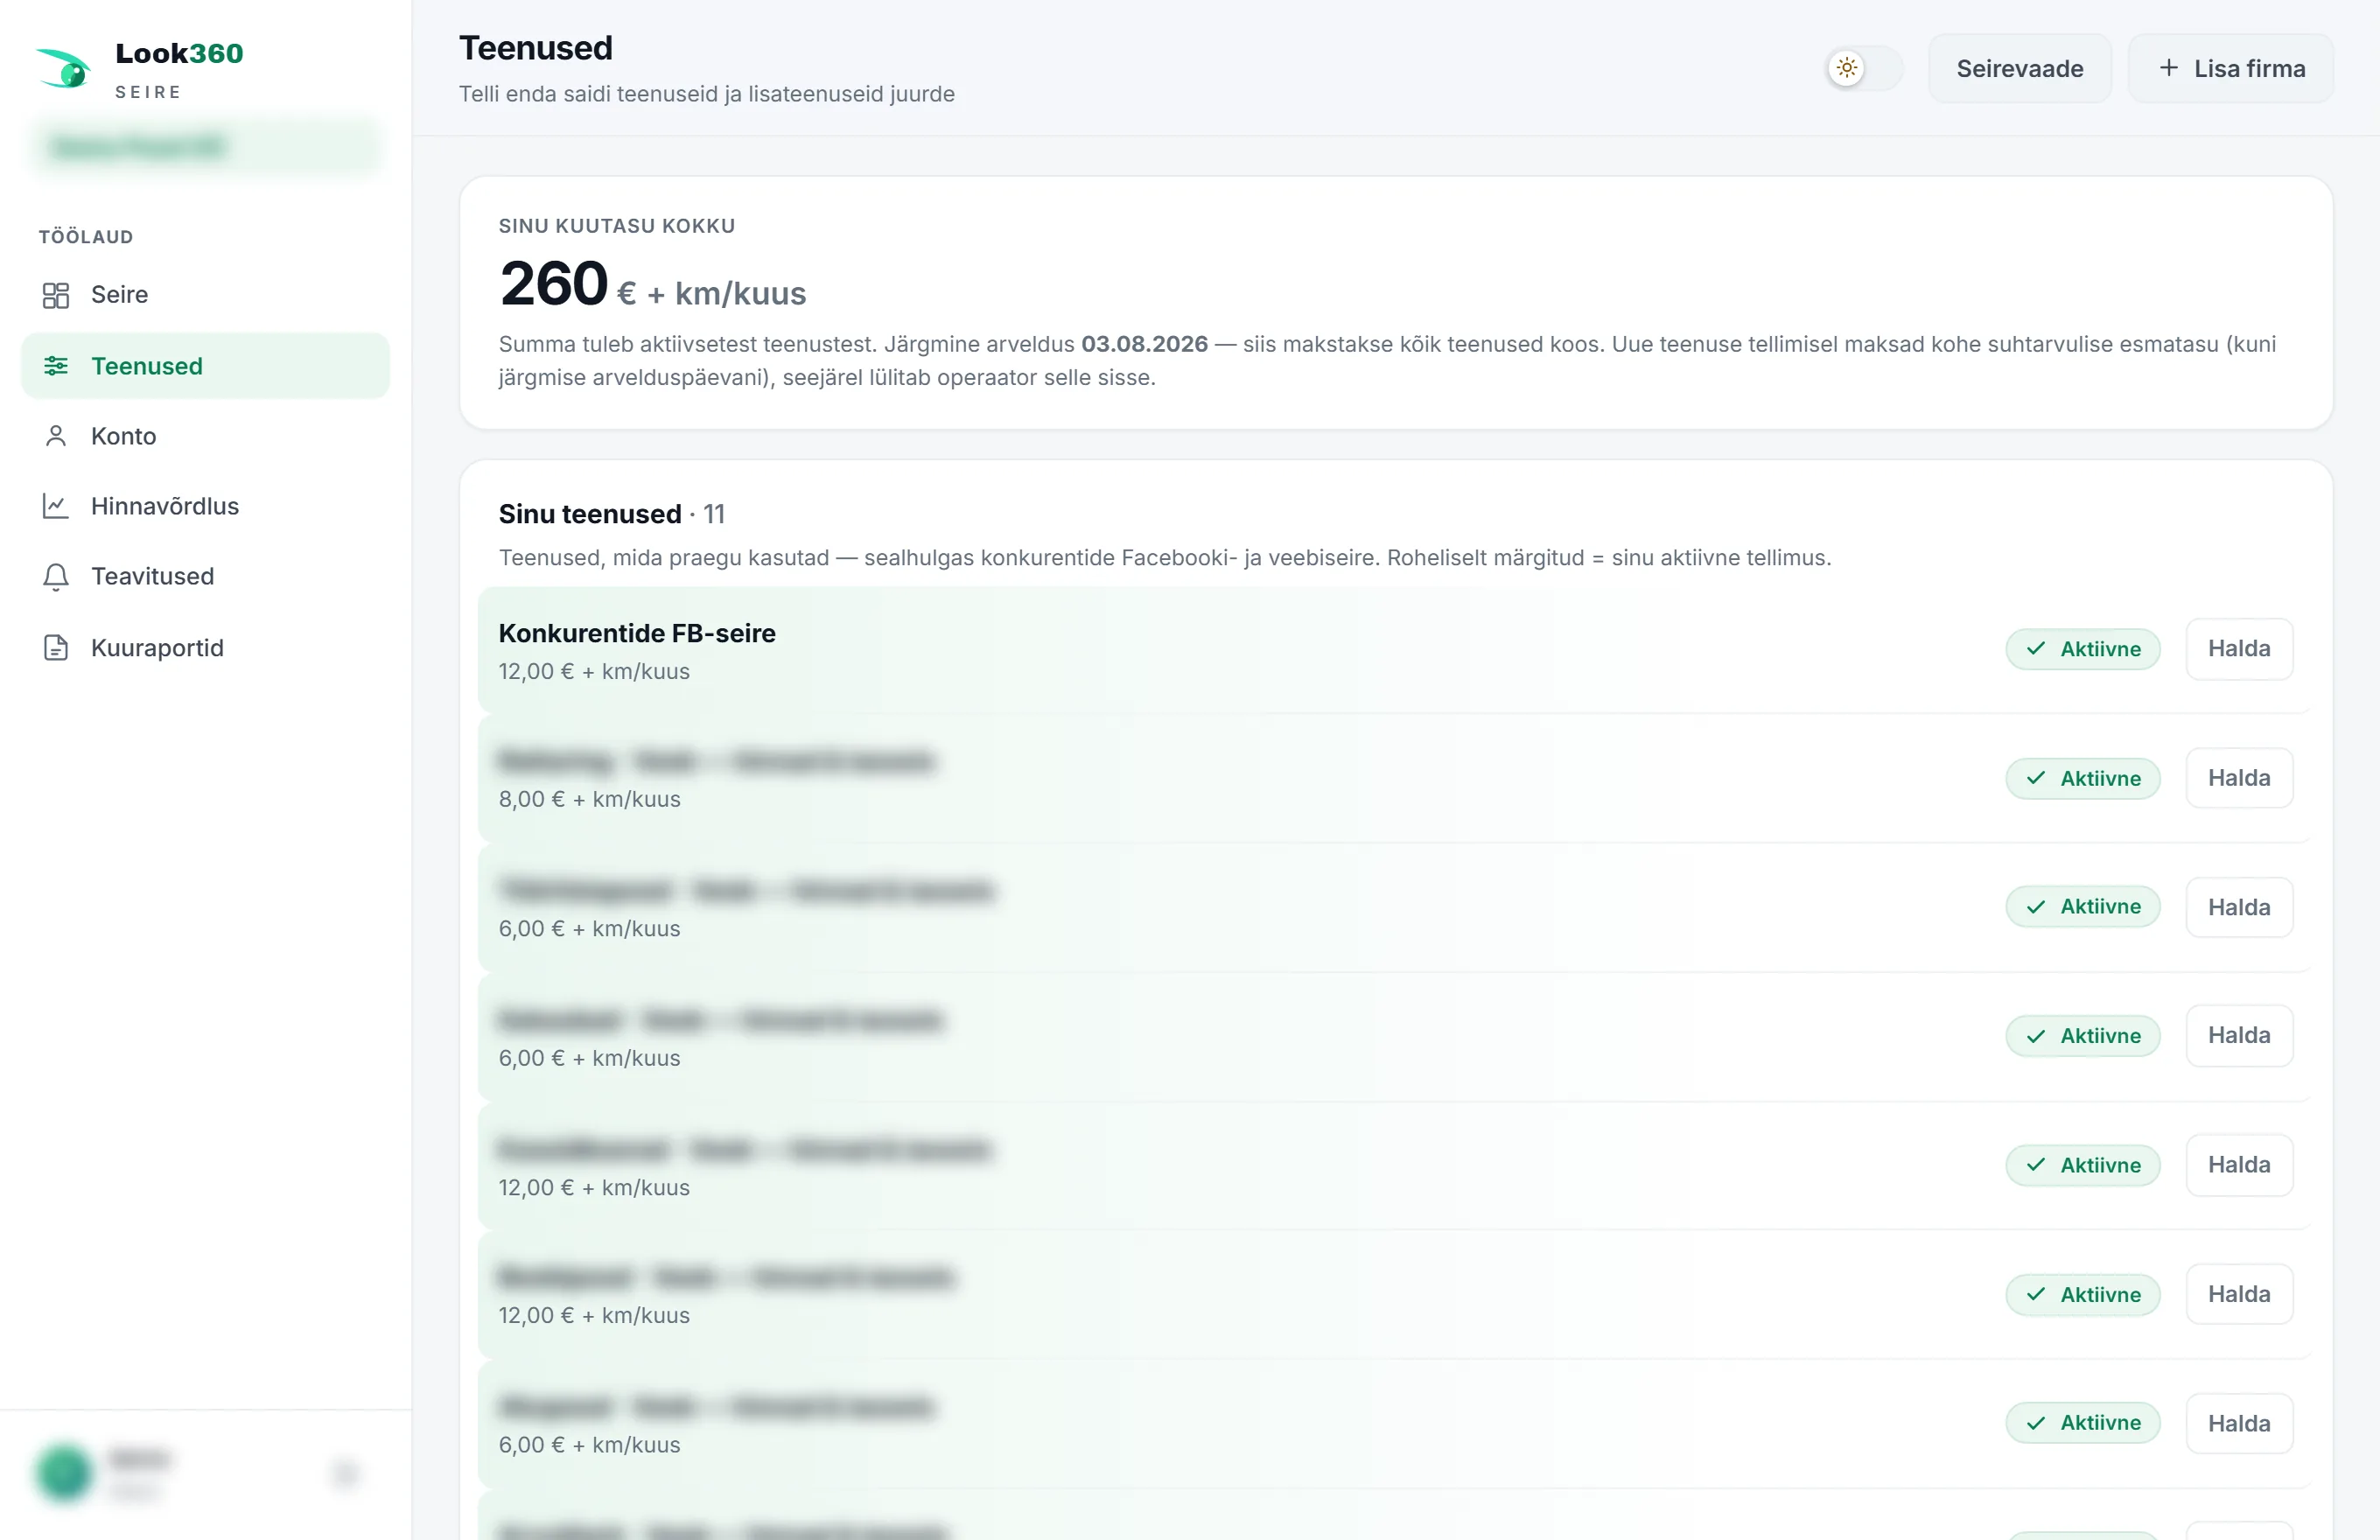
Below is everything we offer. All prices are excluding VAT, per month.
Scans your online store's products and finds gaps: missing images and alt texts, empty or too-short descriptions, broken prices, duplicate products. Gives a health % and a fix list.
Tracks your keyword positions on Google and finds content gaps – topics you have no content for yet. The price depends on the number of monitored keywords.
Checks whether your website/online store is up and how quickly it responds. Lets you know if the site goes down or becomes slow.
Connects your online store and accounting software (e.g. Directo) – orders, stock and prices move automatically, without manual transfer.
Competition-based price recommendations for your own store that you can write to WooCommerce in one click (see Section 14).
Tracks competitors' Facebook posts: new products, campaigns, events, price announcements. All in one feed, with new items highlighted.
Tracks competitors' active Facebook ads – what they advertise, how many ads are running and when they started or stopped.
Tracks a competitor's online-store prices, sale prices, stock and assortment. Provides history charts and feeds the price comparison. Tiered: €8 for every up to 2000 products.
You set your products' RRP (recommended retail price) and MAP (minimum advertised price); the system monitors which resellers breach them (see Section 15).
We train your team on the system and online-store topics, so everyone can put monitoring and data to work in their favour.
On request we automate your recurring work – reports, syncs, notifications, data flows. Press Request a quote.
Health check + SEO + uptime + repricing.
Competitors' FB monitoring + online-store health check + uptime.
Health check + uptime + ERP integration.
How to order
- Each service shows a price in €/month. Press Order, confirm in the dialog and pay the initial fee; packages order several services at once.
- Active services are green. Cancel ends a service; competitor monitoring is managed under Add company and the Manage button.
- Paid – awaiting activation: the initial fee has been paid and an operator will switch the service on shortly.
When you order a new service you pay a pro-rata initial fee straight away – only up to the next billing day. After that, all services are billed together, on the anniversary of your sign-up date.
13 How payment works
Every payment starts from a confirmation dialog stating the amount and what you are paying for. You can always Cancel.
- Paying now, we send you to a secure payment gateway – you pay by bank link or card, and the data/service opens right after payment.
- By invoice – we email you an invoice. The content opens in full once the payment has arrived.
- The initial fee is always pro-rated up to the next billing day; thereafter the full monthly fee applies.
- Billing is done for all services together, on the anniversary of your sign-up date.
14 Pricing
The Pricing menu item is visible only if you have the repricing service subscribed. There you see competition-based price recommendations for your own store.
- Regenerate recalculates the recommendations from scratch; Rules and History show the settings and earlier changes.
- For each recommendation: Write pushes the price to the store, Leave as is keeps the price and ignores the product for the chosen number of days, Skip skips the recommendation.
By default everything is in test mode: recommendations are calculated, but no "Write" changes your store. We switch on live mode (real price writing) together with you. Floors (a price floor, MAP) prevent a recommendation that is too low.
15 Brand monitoring
The Brand monitoring menu item is for brand owners and importers. If you have reseller price monitoring subscribed, this is where you define your products' price rules and see who breaches them.
- Add your products together with their RRP (recommended retail price) and MAP (minimum advertised price). Products can be added one by one or imported.
- The system compares the prices of the monitored resellers against your RRP/MAP.
- You see a list of breaches – who is selling below MAP or deviating from RRP – and can export CSV.
You maintain your brand's price level – and when you find a breach, you have a documented basis to talk to the reseller.
16 Real-world examples
Here is how the features tie together into everyday work.
1. A competitor dropped a price
The daily email brings "Competitor X: 12 price drops". You open Price comparison and see that on three products you are now the most expensive on the market. Pricing offers new prices – you write them to the store in one click.
2. A product ran out at a competitor
You have set an "out of stock" notification rule on one key product. When it runs out at a competitor, a push comes to your phone. You respond: raise the price or advertise that you have it in stock.
3. A new competitor on the market
You hear of a new store. Add company → online store + Facebook → confirm the monthly fee. Within a few minutes you see its assortment, prices and Facebook activity.
4. My online store's health is poor
Online-store health shows 109 critical errors – missing images and alt texts. You work through the fix list; on the next scan the health % rises.
5. A monthly overview for the board
On the 1st of the month, the PDF monthly report arrives in your inbox automatically. You forward it to the board – a summary of price movements, assortment and market position in one file.
6. A reseller went below MAP
You are a brand owner. Brand monitoring shows that one reseller is selling a product below the agreed MAP. You export the breach and get in touch with the reseller.
7. Data into your BI
You want the prices and stock in your Power BI report. Account → Create API key → connect the REST API via Power Query. The data refreshes automatically.
17 App and dark mode
- Install as an app – on your phone you can add the dashboard to your home screen like an app: open the browser menu and choose "Add to Home Screen". From then on Look360 opens straight from the icon and full-screen – nothing to download.
- Notifications to your phone – the Enable push notifications button sends important changes straight to your device. On iPhone this works after installing as an app.
- Dark / light mode – the top-bar toggle (sun/moon) switches the theme. Your choice is remembered.
- On a phone – the menu is hidden behind the ☰ button in the top corner; the content adapts to the screen width.
- Signing out – the door-out icon next to your username at the bottom left.
18 Help and contact
If you have a question or a concern, we reply in English – a real person, not an automated response.
- Email: info@look360.eu
- Phone: +372 5362 0246
- Frequently asked questions: the home-page FAQ
Sign in → look at the green/yellow/red on the dashboard → add more companies and services → set notification rules → the important changes reach you by email and push as well. There is nothing more to do.